Trading in a Nutshell
A comprehensive yet accessible guide to understanding the fundamental concepts of trading, from its historical roots to modern automated systems.
Trading in a Nutshell
A Quick Note
Trading can feel overwhelming when you’re just starting out, but don’t worry - we’ve got you covered! This article breaks down the most important concepts you need to know. While we can’t cover everything (trading is pretty complex!), this guide will give beginners a solid foundation and might even serve as a helpful refresher for experienced traders.
A Brief History
Trading has been around for centuries - it’s basically as old as civilization itself! The invention of money made everything so much easier, allowing people to specialize in what they do best and trade for what they need. Some regions naturally became better at producing certain goods, creating opportunities for profitable exchanges.
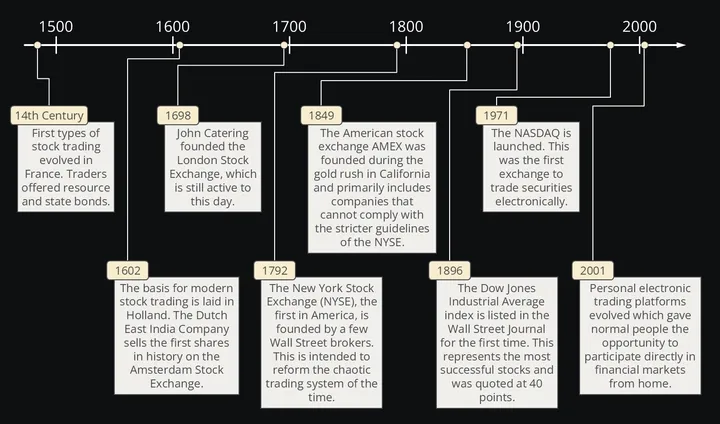
Things really picked up between 1815 and World War I, with trade becoming more open and accessible. After a rough patch during the Great Depression, global trade bounced back stronger than ever from the 1950s onward.
The real game-changer came in the 1970s with electronic trading (hello, NASDAQ!). But the 1990s and 2000s? That’s when things got really interesting with the internet boom and personal trading platforms. Slowly but surely, electronic trading replaced those old-school trading floors and phone calls.
Want to dive deeper?
Trading vs. Investing - What’s the Difference?
Think of trading and investing like sprinting versus marathon running - both aim to make money, but they take very different approaches.
Trading is the sprint. You’re buying and selling frequently, sometimes holding positions for just minutes or hours. Traders love volatility and try to profit from both rising and falling markets. It requires constant attention and quick decision-making - definitely not a casual hobby!
Investing is the marathon. You buy assets and hold them for years, maybe even decades. Investors focus on a company’s fundamentals and long-term potential, building wealth gradually over time. It’s more like planting a tree and watching it grow.
Both can be profitable, but they require different skills and mindsets. Choose the approach that fits your lifestyle and goals!
Check this out: The Plain Bagel - The Difference Between Trading and Investing
Bid, Ask, and Spread - The Market’s Language
Let’s use a simple example: imagine you’re at a fish market.
The bid is what buyers are willing to pay for that fresh fish - it’s the maximum they’ll spend.
The ask (or offer) is what sellers want for their fish - the minimum they’ll accept.
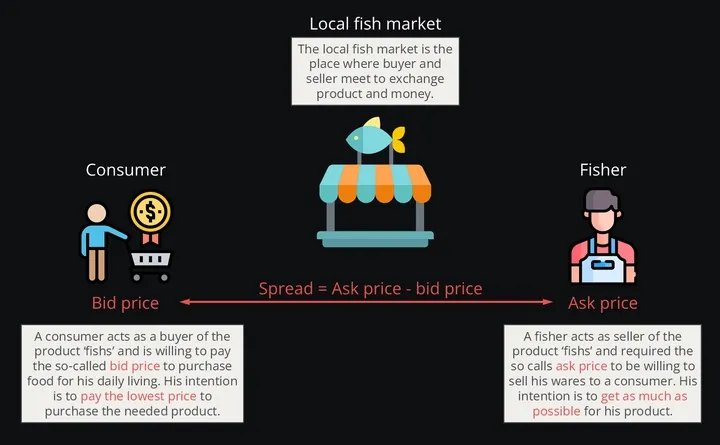
The spread is simply the difference between these two prices. The fish market owner profits from this spread - the wider the gap, the more money they make.
This same concept applies to all trading, whether you’re dealing with stocks, currencies, or any other financial instrument. Pretty straightforward once you get it!
Learn more: Wikipedia - Bid-ask spread
Contract for Differences (CFDs) - Trading Without Owning
CFDs are like making a bet on price movements without actually buying the underlying asset. It’s similar to our fish market analogy, but instead of buying the fish, you’re just betting on whether its price will go up or down.
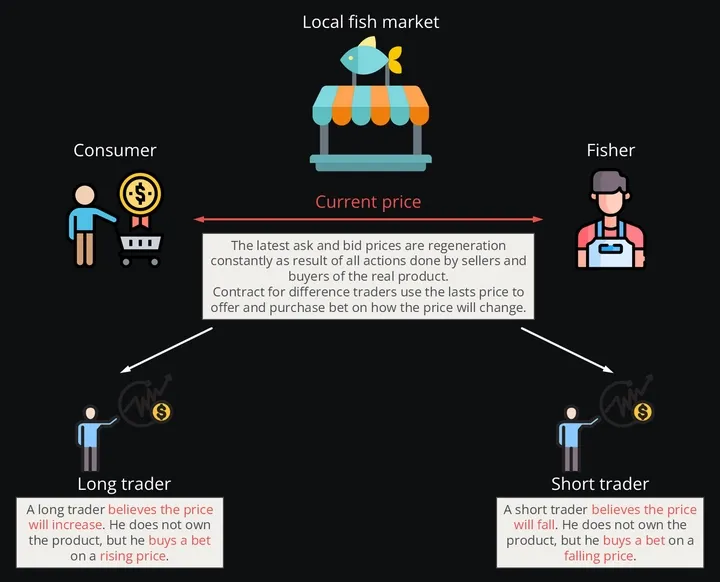
Here’s the cool part: with CFDs, you can profit whether prices rise (going long) or fall (going short). The “contract for differences” is literally the difference between where you enter and exit the trade.
CFDs use leverage, which means you only need a small deposit to control a much larger position. This can amplify your profits, but be careful - it can also magnify your losses!
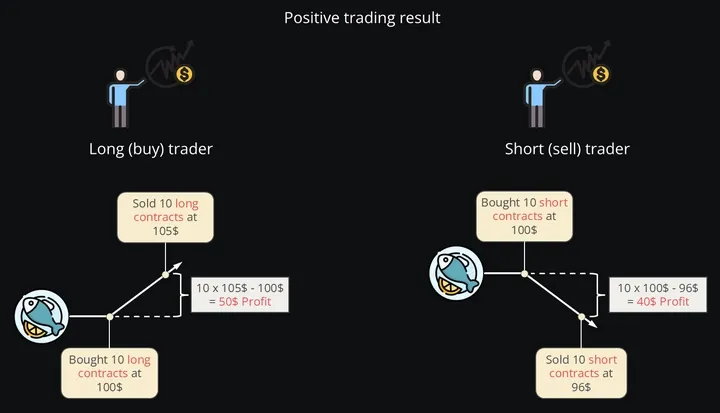
When the market moves in your favor, you’re happy. But when it moves against you…
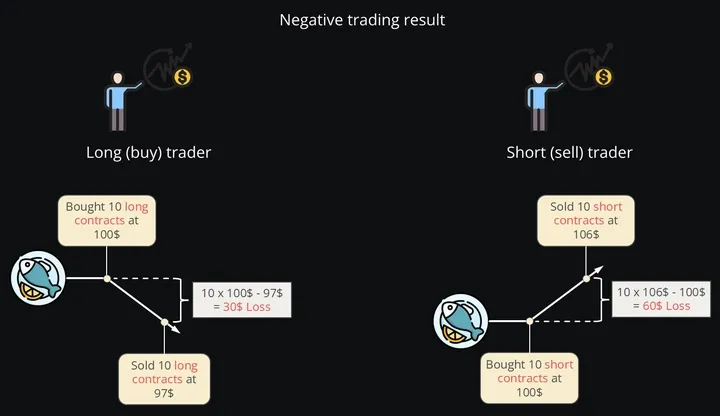
Well, let’s just say it’s not as fun. Always remember that losses can exceed your initial deposit with leveraged products.
More info: Wikipedia - Contract for difference
Leverage and Margin - The Double-Edged Sword
Leverage is like using borrowed money to increase your buying power. With 1:10 leverage, your $1,000 can control a $10,000 position. Pretty powerful stuff!
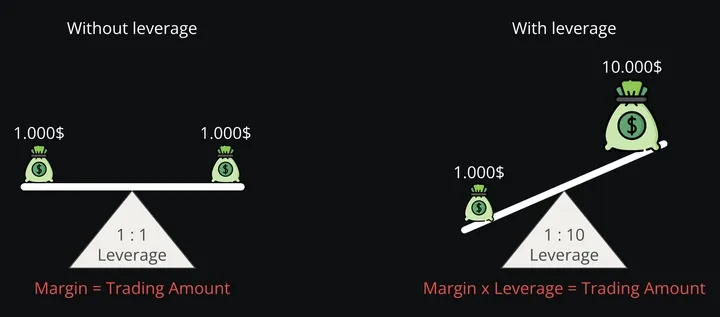
Margin is the collateral you put up - think of it as a security deposit. Different brokers and assets have different margin requirements.
Here’s where it gets interesting: leverage can multiply your profits when you’re right…
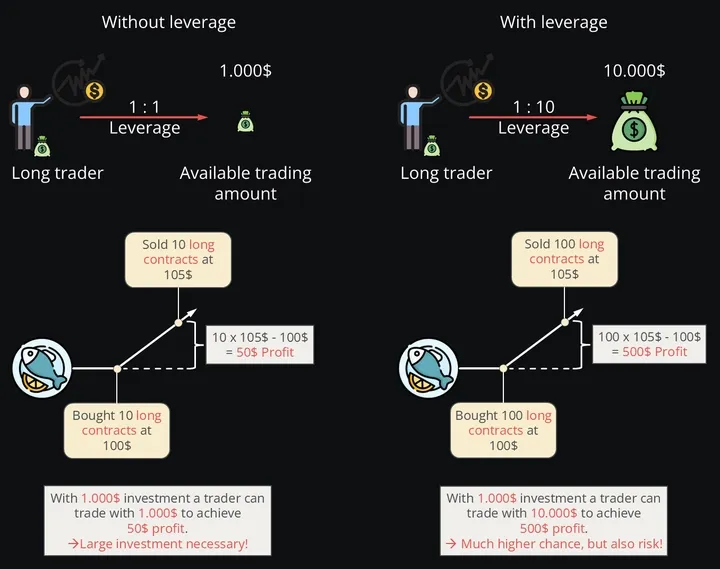
But it can also multiply your losses when you’re wrong. It’s like a financial amplifier - whatever happens gets turned up to 11!
The key is understanding and managing these risks effectively. Never risk more than you can afford to lose.
Want to learn more? CFD leverage and margin
Lot Size - Getting the Quantities Right
Lot size is simply how much of an asset you’re buying or selling in one go. Different markets have different standards:
- Stocks: Usually 100 shares (called a “round lot”), though you can trade smaller amounts too
- Forex: Standard lot is 100,000 units, but you can also trade mini lots (10,000), micro lots (1,000), or even nano lots (100)
The bigger your lot size, the bigger your potential profit or loss. Choose wisely based on your risk tolerance!
Financial Instruments - What Can You Trade?
The trading world offers a smorgasbord of options:
Forex The world’s largest market! With over 170 currencies and about $7.5 trillion traded daily, it never sleeps (literally - it’s open 24/5). The sheer size means you can get in and out of trades quickly.
Metals From precious metals like gold ($170 billion market) to base metals like copper and zinc. Even rare earth metals are getting attention thanks to electric vehicles and green tech.
Cryptocurrencies The new kid on the block! Growing from $826.6 million in 2020 to a projected $1.9 billion by 2028. Bitcoin, Ethereum, and friends are reshaping how we think about money.
Indices These track groups of stocks, giving you a snapshot of entire markets. Think S&P 500, Dow Jones, or Germany’s DAX. It’s like buying a slice of the whole market.
Energies Oil, gas, renewable energy - basically anything that powers our world. With the green energy transition happening, this sector is constantly evolving.
Stocks The classic! Individual company shares where you can own a piece of businesses you believe in. The US stock market alone accounts for nearly 60% of global stocks.
Useful links:
Order Types - How to Tell the Market What You Want
Think of order types as different ways to communicate with the market:
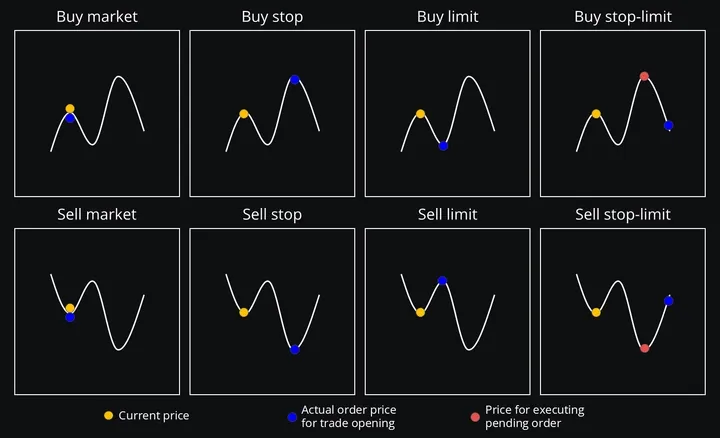
Buy Orders
- Market Buy: “I want it now at whatever price!”
- Buy Limit: “I’ll buy it, but only at this price or lower”
- Buy Stop: “Start buying when the price hits this level”
- Buy Stop-Limit: “Start trying to buy at my limit price when the stop is hit”
Sell Orders
- Market Sell: “Sell it now at whatever price!”
- Sell Limit: “Sell it, but only at this price or higher”
- Sell Stop: “Start selling when the price drops to this level”
- Sell Stop-Limit: “Start trying to sell at my limit price when the stop is hit”
Each type gives you different levels of control over price and execution speed.
More details: The Basics of Trading a Stock: Know Your Orders
Trading Platforms - Your Gateway to the Markets
A trading platform is your command center - it’s the software that connects you to the markets. Most platforms offer real-time quotes, charts, news, and analysis tools.
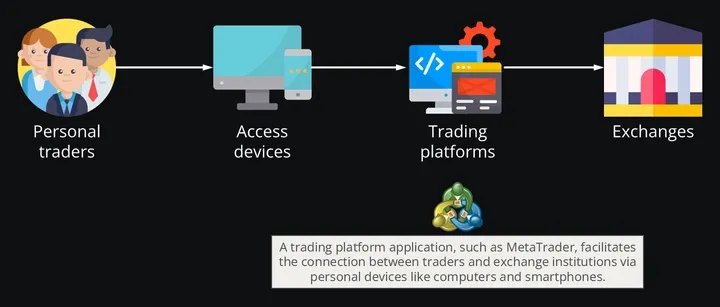
MetaTrader is probably the most popular platform out there. It comes in two flavors - MT4 and MT5 - and offers everything from basic charting to advanced automated trading. Best part? It’s available on desktop, web, and mobile.
Want to get started? Check out our MetaTrader Simplified tutorial.
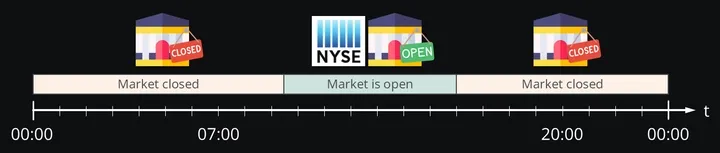
Market Hours and Swap - When and What It Costs
Market Hours vary by region. The New York Stock Exchange runs 9:30 AM to 4:00 PM Eastern Time, while Forex markets run 24/5 (Sunday 5 PM to Friday 4 PM EST) since there’s always a financial center open somewhere.
Swap is the interest you pay or earn for holding positions overnight. It’s like a borrowing cost since you’re using leverage.
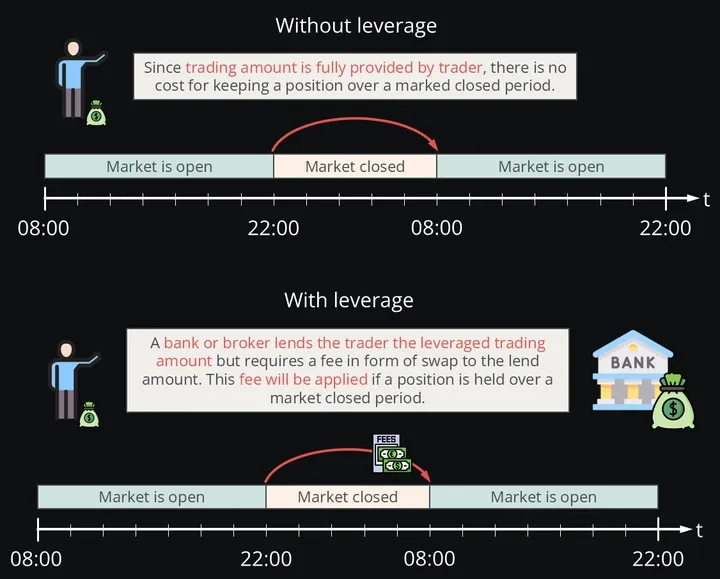
- Weekday swap: Applied daily for positions held overnight
- Weekend swap: Usually charged on Wednesdays (triple swap) to account for Saturday and Sunday
The swap can be positive or negative depending on the currency pair and your position direction.
Learn more: Admiral Markets - What Is the Forex Swap?
Commission - The Cost of Doing Business
Commission is what you pay your broker for their services. Some charge a flat fee per trade, others take a percentage of the transaction value. It’s like a service fee for accessing the markets.
Understanding your broker’s fee structure is crucial since these costs can eat into your profits over time.
Details here: Commission: Definition and Examples, Vs. Fees
Stop Loss and Take Profit - Your Safety Net and Goal Post
These are your automated assistants that work even when you’re sleeping:
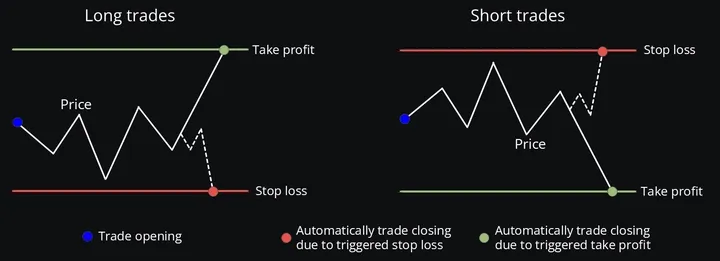
Stop Loss (SL): Automatically closes your position when losses reach a certain level. Think of it as your emergency exit. If you bought a stock at $50 and set a stop loss at $45, you’ll automatically sell if the price drops to $45, limiting your loss to $5 per share.
Take Profit (TP): Automatically closes your position when you’ve made enough profit. Using the same example, if you set a take profit at $60, you’ll automatically sell when the price reaches $60, locking in your $10 profit.
Both are essential risk management tools that help remove emotion from your trading decisions.
More info: What is Stop Loss (SL) and Take Profit (TP) and how to use it?
Trailing Limits - The Smart Followers
Trailing stops are like smart assistants that follow favorable price movements:
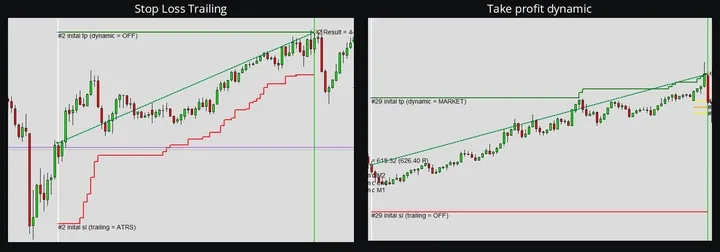
Trailing Stop Loss: Moves with the market when prices go in your favor but stays put when they move against you. It’s like having a stop loss that automatically adjusts to lock in more profits.
Trailing Take Profit: Adjusts your profit target as prices move favorably. This is more complex and usually best handled by algorithms, especially useful for short-term trading strategies.
These tools offer more flexibility than fixed levels and can help maximize profits.
Learn more: How the Trailing Stop/Stop-Loss Combo Can Lead to Winning Trades
Trade Splitting - Breaking It Down
Trade splitting is like ordering a pizza in slices instead of trying to eat the whole thing at once. Large orders are broken into smaller chunks to:
- Avoid moving the market price too much
- Get better average prices
- Keep your trading strategy private
It’s especially common in algorithmic trading where computers automatically handle the splitting process.
Details: Order Splitting: Meaning, Execution, Example
Hedging - Insurance for Your Trades
Hedging is like having insurance for your trades. There are two main approaches:
Hedging with Opposing Assets If you own tech stocks, you might short a tech index to protect against sector-wide declines. In Forex, EURUSD and USDCHF often move in opposite directions.
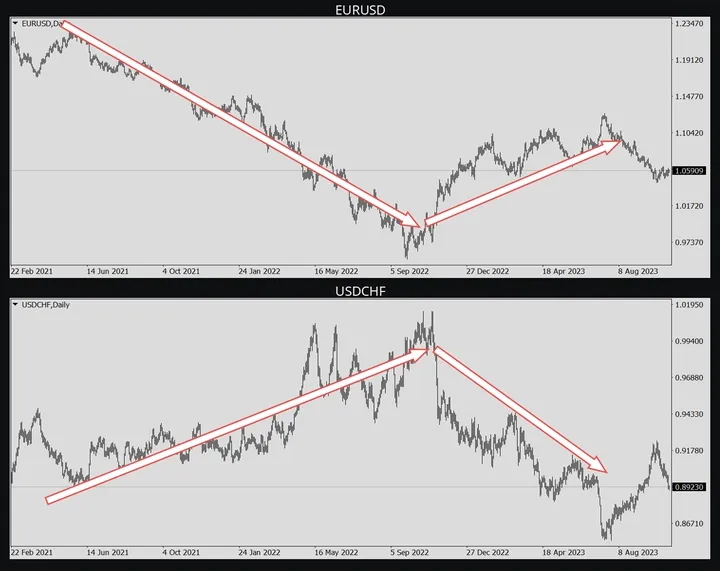
Hedging with the Same Asset You can open opposite positions in the same instrument. If you’re long on a currency pair but worried about a pullback, you could open a small short position as insurance.
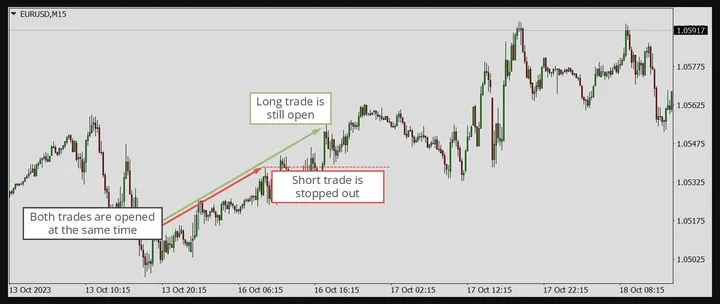
Remember: hedging can protect you, but it can also limit your profits. Use it wisely!
Useful resources:
Symmetric and Asymmetric Charts - Understanding Market Behavior
Symmetric Charts (like Forex pairs): Both sides have roughly equal forces. When someone sells USD, another buys EUR. Prices tend to oscillate around relatively stable levels over the long term.
Asymmetric Charts (like stocks or gold): One direction is favored over time. The S&P 500 has averaged 6-8% annual growth for decades, favoring long positions. These markets often see faster declines than rises.
Understanding which type you’re trading helps shape your strategy!
Risk and Money Management - The Foundation of Success
This is probably the most important section - pay attention!
Risk Management: Never risk more than you can afford to lose. Use stop losses, diversify your trades, and always have a plan.
Money Management: Decide in advance how much of your account you’ll risk per trade (many pros suggest 1-2% maximum).
Stop Loss and Order Volume Calculate your position size based on your stop loss distance. If you’re willing to risk $100 and your stop is 50 pips away, adjust your lot size accordingly.
Risk Ratio This is the relationship between potential risk and reward. A 1:2 risk ratio means you risk $1 to potentially make $2.
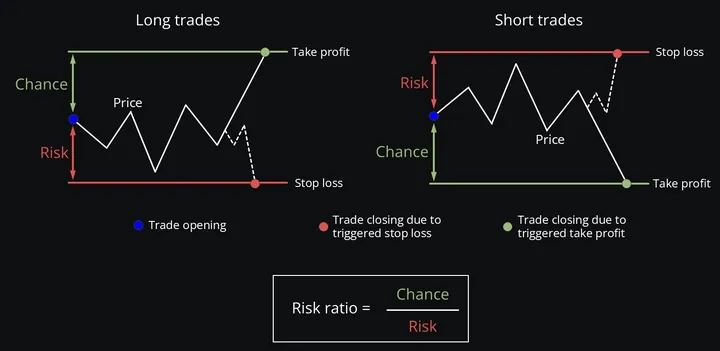
Different trading styles have different typical risk ratios:
- Long-term investing: 5-10 (high reward potential)
- Swing trading: 1.4 (more conservative)
- Day trading: Often lower due to shorter timeframes
Master these concepts, and you’ll be ahead of most traders!
Read more: Risk Management Techniques for Active Traders
Trading Journal - Your Secret Weapon
A trading journal is like a diary for your trades. Record everything: what you traded, when, why, how much, and how you felt. Include charts if possible.
The goal isn’t just record-keeping - it’s pattern recognition. Over time, you’ll spot your strengths, weaknesses, and habits. This self-awareness is invaluable for improvement.
Most successful traders swear by their journals. It’s one of the best investments you can make in your trading education.
More insights: The Trading Journal: An Untapped Powerhouse
Evaluating Trading Strategies - The Report Card
Every strategy needs regular evaluation based on two key metrics:
Performance
How much money did you make or lose? But don’t just look at returns - consider the risk taken. A strategy with 20% returns but massive risk might be worse than one with 15% returns and low risk.
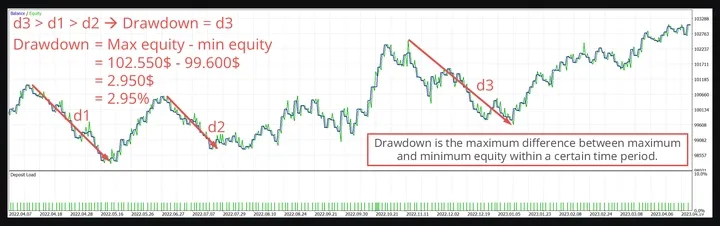
Drawdown
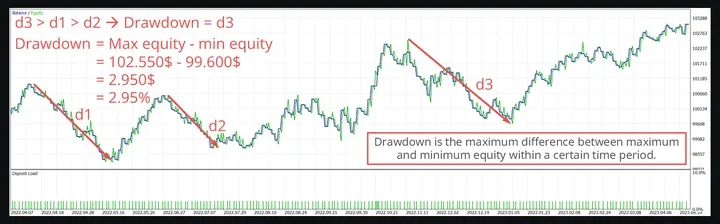
This measures the decline from peak to trough - basically, how much you lost from your highest point before recovering. A 20% maximum drawdown means you were down 20% at your worst moment.
Good strategies maximize performance while minimizing drawdown. It’s all about finding the right balance!
Learn more:
- Trading Performance Metrics
- Maximum Drawdown (MDD) Defined, With Formula for Calculation
- Drawdown: What It Is, Risks, and Examples
Trading Signals - Reading the Market’s Hints
Markets give us signals all the time - we just need to know how to read them:
Candlestick Patterns These are like the market’s body language. A bullish engulfing pattern might signal an uptrend, while a doji shows indecision. They’re not crystal balls, but they’re useful hints when combined with other analysis.
Read about them: Wikipedia - Candlestick pattern
Chart Patterns Head and Shoulders, Double Tops and Bottoms, Triangles, and Flags - these formations can hint at future price movements. Like candlesticks, they’re most effective when used with other tools.
More info: Wikipedia - Chart pattern
Fibonacci Patterns Based on mathematical ratios, these levels (23.6%, 38.2%, 50%, 61.8%) often act as support or resistance. Many traders watch these levels for potential reversals or continuations.
Learn more: Wikipedia - Fibonacci retracement
Indicators Mathematical calculations that help identify trends and signals. There are leading indicators (like RSI) that try to predict movements, and lagging indicators (like Moving Averages) that confirm trends after they start.
Details: Using Trading Indicators Effectively
Oscillators These fluctuate between overbought and oversold levels. RSI above 70 might suggest overbought conditions, while below 30 could indicate oversold. The MACD is another popular oscillator.
More: Oscillator: What They Are and How They Work
Elliott Waves A complex theory suggesting markets move in predictable wave patterns - five waves in the main direction, followed by three corrective waves. It’s fascinating but requires significant study to master.
Info: Wikipedia - Elliott wave principle
Support and Resistance These are price levels where buying (support) or selling (resistance) pressure tends to emerge. Think of them as psychological levels where traders make decisions.
Learn about them: Wikipedia - Support and resistance
News Trading Sometimes the biggest moves come from unexpected news - employment reports, policy changes, geopolitical events. News trading can be profitable but is also highly unpredictable.
More details: Wikipedia - Trading the news
Signal Types - Timing is Everything
Lagging Signals These confirm what already happened. Moving averages are classic examples - they’re reliable for identifying trends but often signal after the move has already begun.
Info: Wikipedia - Lagging indicators
Coincident Signals Signals that happen in real-time are rare. News events come closest - they can cause immediate market reactions. Great for scalping and day trading strategies.
Details: Wikipedia - Coincident indicators
Leading Signals These try to predict future movements. Oscillators like RSI or Stochastic aim to spot reversals before they happen. When they work, they’re gold. When they don’t… well, that’s trading!
Learn more: Wikipedia - Leading indicators
Broker Types - Your Gateway to the Markets
Your broker is your connection to the markets, so choose wisely:
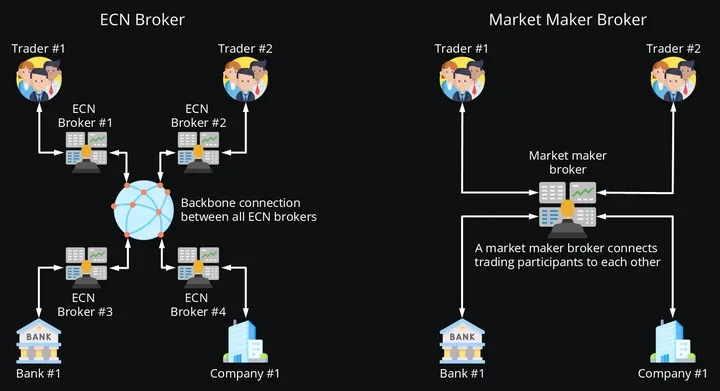
ECN Broker Electronic Communication Network brokers connect you directly to other market participants. They typically offer tighter spreads and more transparent pricing but might charge commissions. Think of them as matchmakers - they just connect buyers and sellers.
Market Maker Broker These brokers take the other side of your trade and profit from the spread. They provide liquidity but might have conflicts of interest since they’re essentially betting against you. Not necessarily bad, just different.
Understanding your broker’s model helps you make informed decisions about costs and potential conflicts.
Compare them: What is the Difference Between ECN and Market Maker?
Timeframes and Fractals - The Big Picture
Timeframes determine how long you hold positions:
- Scalping: Seconds to minutes (high intensity!)
- Day Trading: Close everything by day’s end
- Swing Trading: Days to weeks
- Position Trading: Months to years
Here’s something cool: markets show fractal behavior - patterns repeat at different timeframes. A pattern you see on a daily chart might also appear on an hourly chart, just at a smaller scale.
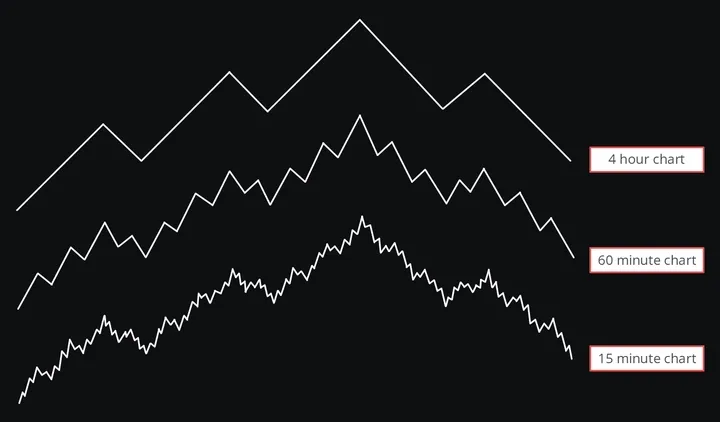
This fractal nature is why multi-timeframe analysis is so powerful. You can spot the big trend on higher timeframes while timing entries on lower ones.
Explore this concept: Trading Fractals: The Power of Multi-time Frame Analysis with Bookmap
Volatility - The Market’s Heartbeat
Volatility measures how much and how fast prices move. High volatility means big potential profits (and losses), while low volatility suggests smaller, steadier movements.
Economic events, news, and market sentiment all influence volatility. Some traders love high volatility for its profit potential, while others prefer calmer markets for more predictable strategies.
Understanding volatility helps you choose appropriate strategies and position sizes. In highly volatile markets, you might want smaller positions to manage risk.
Learn more: Volatility: Meaning In Finance and How it Works with Stocks
Trading Styles - Finding Your Approach
Scalping The speed demons of trading! Multiple trades per day, holding positions for minutes or even seconds. Requires intense focus, quick decisions, and nerves of steel. Not for beginners or the faint of heart.
Read about it: Scalping: Small Quick Profits Can Add Up
Day Trading All positions closed by day’s end. Requires full-time attention and strong discipline. Can be profitable but is also high-stress and high-risk.
Learn more: Day Trading: The Basics and How to Get Started
Swing Trading Hold positions for days to weeks, catching “swings” in price. Good balance between time commitment and profit potential. Popular with part-time traders.
Details: Swing Trading: Definition and the Pros and Cons for Investors
Value Investing Buy undervalued assets and hold for the long term. Requires patience and fundamental analysis skills. Warren Buffett’s preferred style - enough said!
More info: Value Investing Definition, How It Works, Strategies, Risks
Automated Trading - Let the Robots Work
Automated trading uses computer programs to trade based on predefined rules. The main advantages? Speed, emotion-free decisions, and the ability to monitor multiple markets simultaneously.
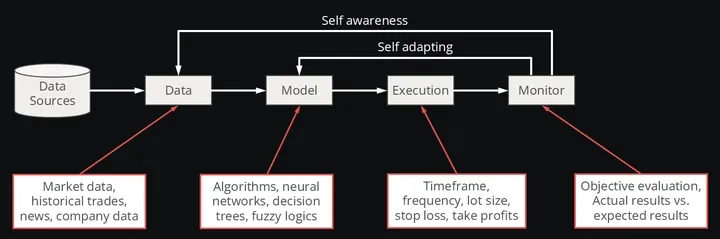
Modern systems can even adapt to changing market conditions - they’re getting pretty sophisticated! However, they’re not foolproof and still need human oversight.
Automated trading can be a powerful tool, but remember: the quality of your results depends on the quality of your strategy and programming.
Learn about it: Algorithmic Trading: Meaning, Benefits and Concerns
Self-Fulfilling Prophecy - When Predictions Come True
Sometimes, widely believed predictions actually cause themselves to come true. If enough traders believe a stock will hit resistance at $100 and place sell orders there, the combined selling pressure might actually create that resistance!
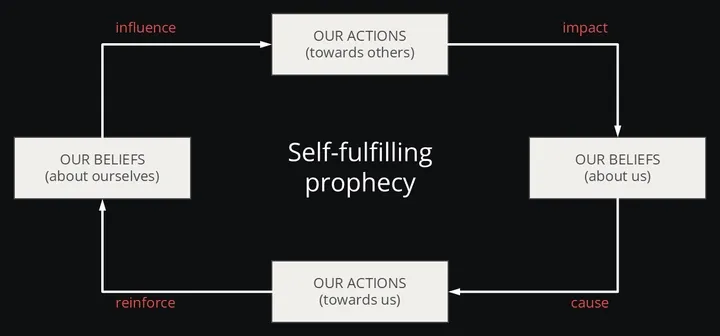
This is why common technical levels often “work” - not because they’re magical, but because many traders are watching the same levels and acting on them.
However, this effect is usually short-lived. With hundreds of indicators and different trader goals, long-term self-fulfilling prophecies are rare.
Interesting read: Is Technical Analysis a Self-Fulfilling Prophecy?
Complex Chaotic System - The Market’s True Nature
Financial markets are complex chaotic systems - they have both systematic and random behaviors. Small changes can have huge effects (think “butterfly effect”), making precise long-term predictions nearly impossible.
This chaos theory perspective suggests that while we can identify patterns and trends, perfect prediction is impossible. The market is influenced by countless factors: trader emotions, economic data, geopolitical events, and even random news.
This doesn’t mean analysis is useless - it just means we should be humble about our predictions and always manage risk accordingly.
The math behind it: Chaos Theory: Meaning, Overview, History
Final Thoughts
Trading is a journey, not a destination. The concepts in this guide are your foundation, but remember - knowledge without practice is just theory. Start small, keep learning, and always manage your risk.
The markets will always be there, but your capital is limited. Protect it, respect it, and let it grow gradually. Most importantly, enjoy the process of learning and improving!
Remember: this article provides educational information, not financial advice. Always do your own research and consider your risk tolerance before trading.