Meta Extender
Detailed user manual
Quick start
INFO
This quick start guide takes only 5–10 minutes to follow.
Download
You can download the Meta Extender here. It is delivered as a single ZIP file that installs into both MetaTrader 4 and MetaTrader 5.
Installation
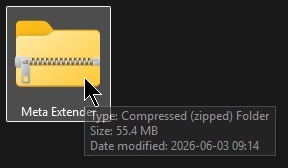
Once the download is complete, you’ll have a ZIP file named Meta Extender. Locate it in your downloads folder and open it to view its contents.
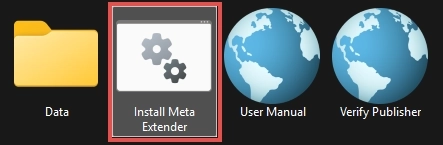
Inside the archive, run the Install Meta Extender script to begin the installation.
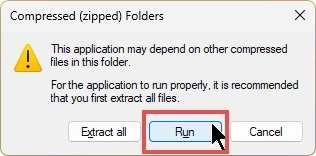
When you start the installer directly from the ZIP, Windows shows a Compressed (zipped) Folders notice. Simply click Run to continue, as shown below. Alternatively, you can extract all files in advance and then start Install Meta Extender from the extracted folder. Note that this step may look slightly different if you open the archive with a third-party tool such as WinZip or WinRAR.
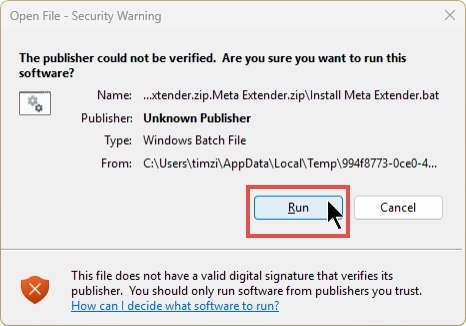
Because the installer script is not digitally signed, Windows displays an Open File - Security Warning that lists the publisher as Unknown Publisher. This is expected, so click Run to proceed. If you’d like to check the file beforehand, use the Verify Publisher shortcut included in the archive.
The Meta Extender Setup wizard then opens and installs the add-on for both MetaTrader 4 and MetaTrader 5. Click Next and follow the on-screen steps to complete the installation.
INFO
The setup installs the Meta Extender into every MetaTrader 4 and MetaTrader 5 installation found on your computer. If you add another MetaTrader later, simply run the installation again to add the Meta Extender to that new instance.
You do not need to update the Meta Extender manually. Whenever a new version becomes available, the Meta Extender notifies you directly in its user interface and asks for your consent before installing it. Nothing is ever updated in the background without your agreement. When you accept, the Meta Extender applies the update and reloads cleanly so the new version takes effect. You can also decline for now and keep running your current version; the Meta Extender will ask you again next time.
Start of application

The Meta Extender interacts with a backend server, so you’ll need to tweak some settings in your MetaTrader. Open the MetaTrader instance you selected during installation and go to the Options menu.
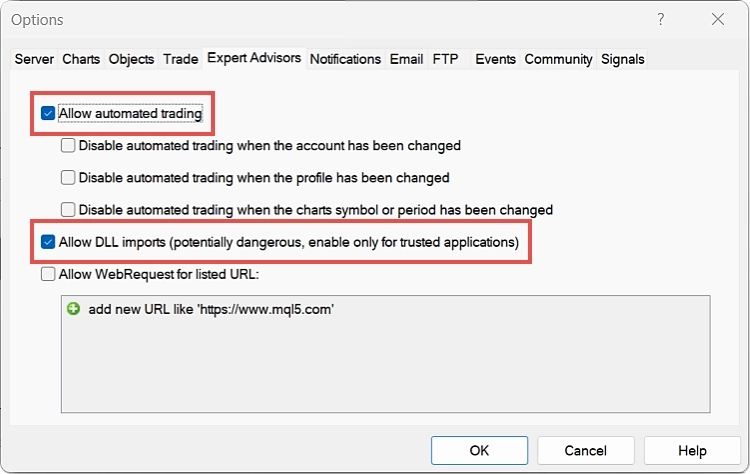
Then, navigate to the Expert Advisors tab and tick the boxes for Allow automated trading and Allow DLL imports.
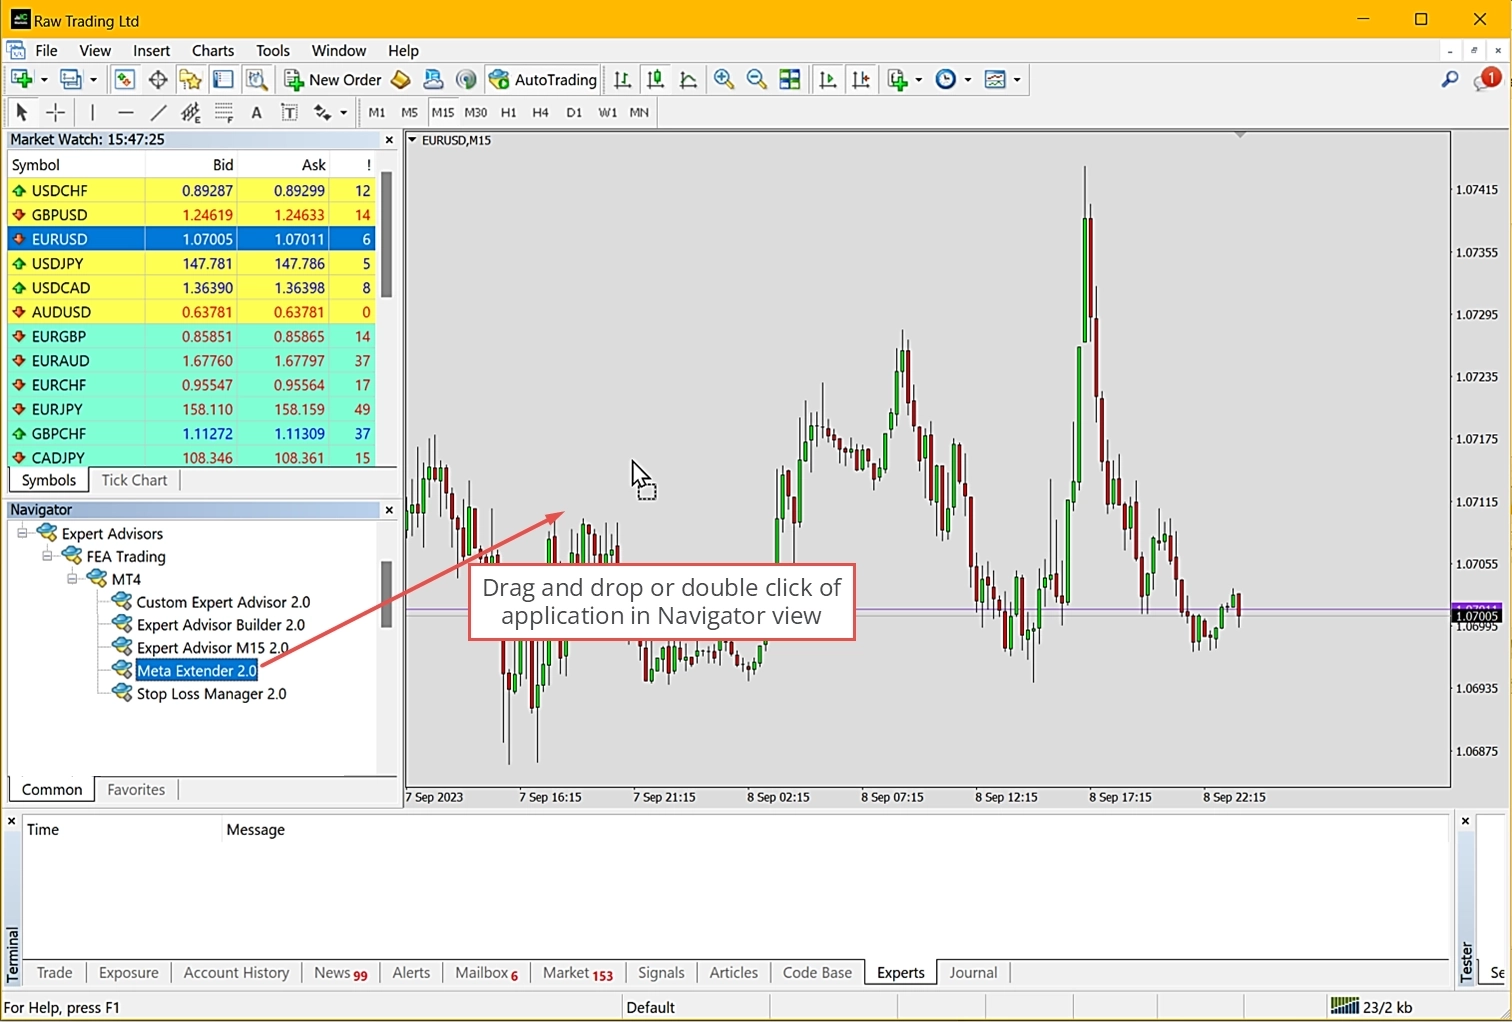
You can find the Meta Extender in the Navigator view under Expert Advisors. If the application isn’t listed yet, simply right-click anywhere in the Navigator and choose Refresh to update the view. To start the application, double-click on it or drag and drop it onto a chart in your chart view.
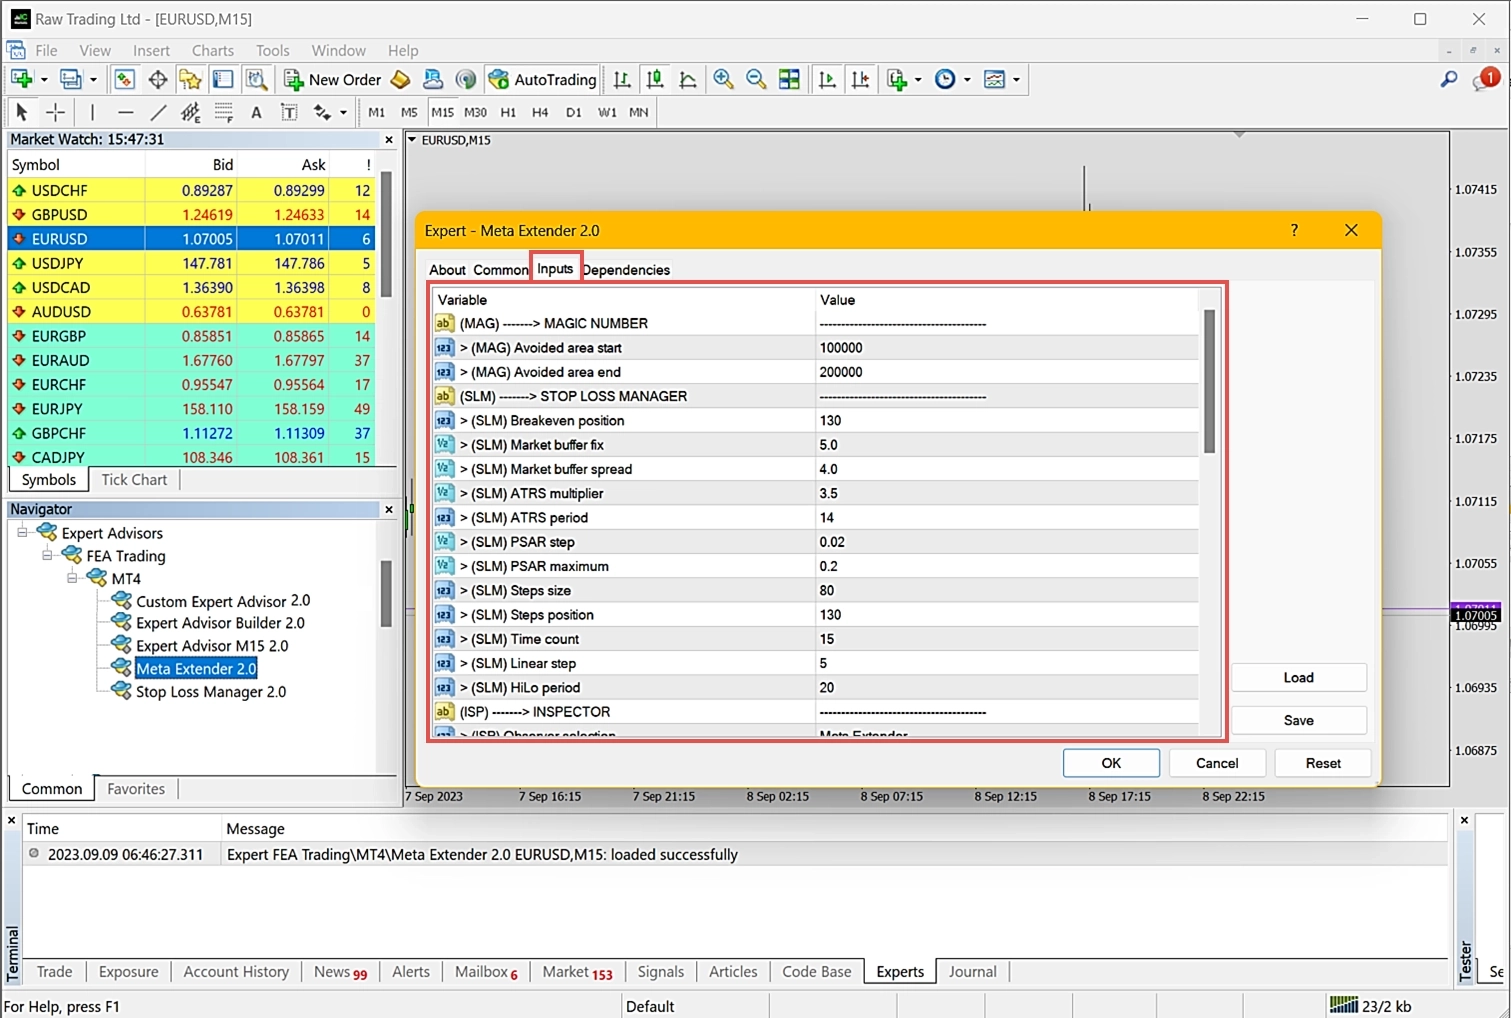
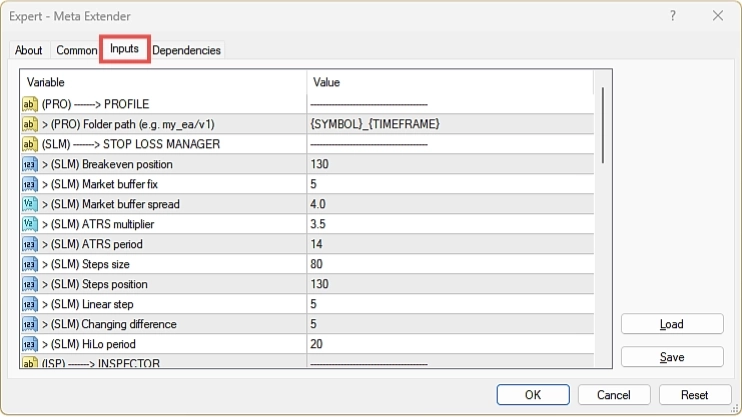
Each time you launch the Meta Extender, a welcome panel appears. This panel lets you check the version number and adjust the input parameters. If you want to change the default settings, navigate to the Inputs tab. Most trading settings can be configured via the user interface while the application runs. However, some settings need to be configured beforehand. Since the default values for the input parameters are already well-adjusted, you can leave all input parameters as they are.
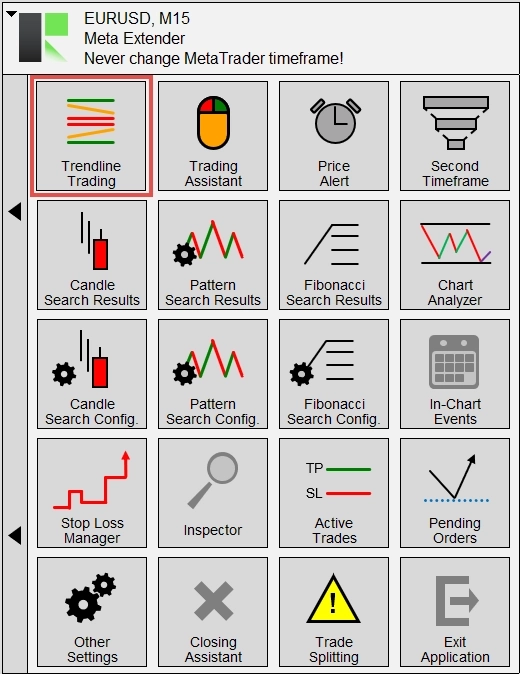
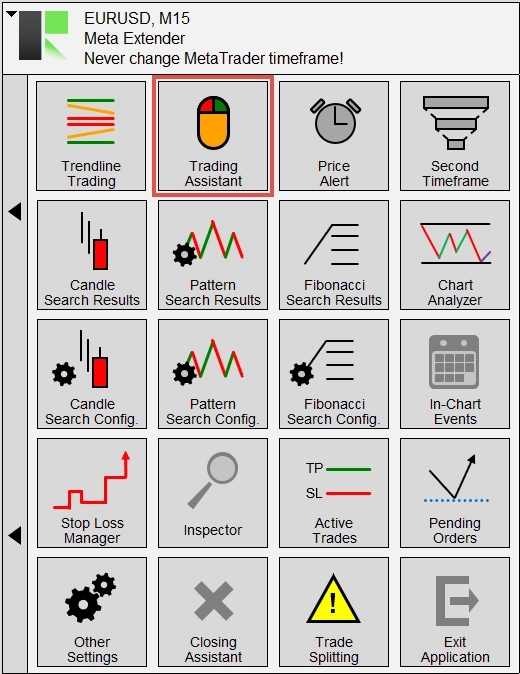
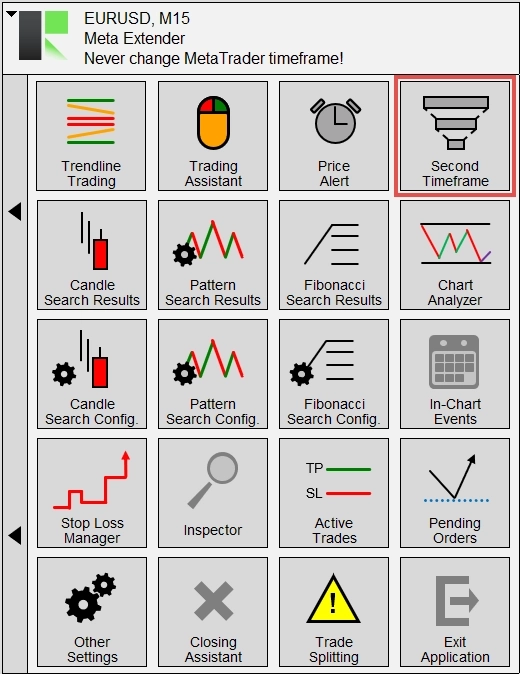
Upon successfully launching the Meta Extender, you will see the home screen containing the widgets overview:
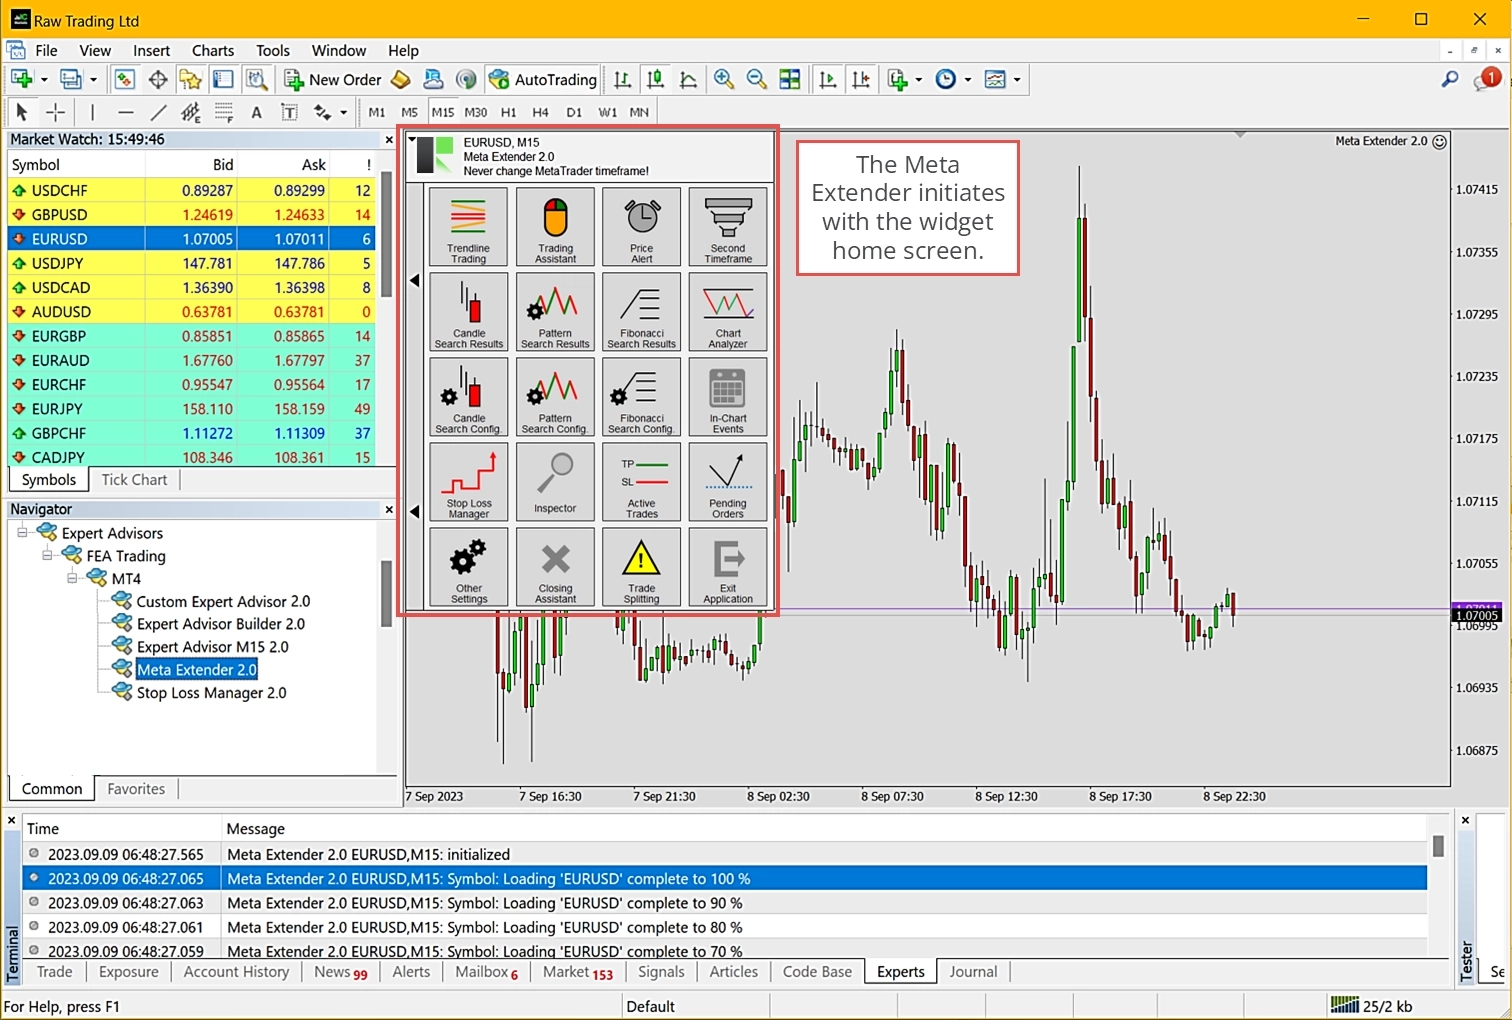
The Meta Extender is now up and running. It’s important to note that changing the MetaTrader timeframe will cause all the Meta Extender to reinitialize. Therefore, sticking with the same timeframe while the Meta Extender is active is strongly recommended. If you want to incorporate a higher timeframe, you can use the Second Timeframe widget. Otherwise, please use a second chart window to analyze other timeframes.
Open an order
Let’s begin by opening the Trading Assistant widget. To launch it, choose the widget from your Meta Extender home screen:

This widget is engineered to aid manual trading with an integrated risk and money management (RMM) tool. It promptly informs you about the crucial aspects of a planned trade and provides a convenient one-click trading panel with an integrated order configurator. For instance, it allows you to open trades with a sophisticated stop loss trailing.
The Meta Extender is designed to be visually intuitive by using lines in the chart view to configure stop loss, take profit, or the pending price. Moreover, a trade and its take profit and stop loss are easily visualized to track previous trades. You can read more about the comfort visualization in the detailed user manual. This feature is extensively used across all products, mainly to visualize modification of the stop loss and take profit values of a trade.
Go ahead with configuring the input fields to understand how the risk and money management can interact with the order configurator. When clicking Place Order, a trade is executed immediately without any additional confirmation request.
After placing an order, you’ll notice that the moment a trade is opened is indicated by a vertical white line. Another vertical line will appear when the trade closes, and between the stop loss and take profit values, they are illustrated with a red and green line. You can manually close a trade using the Meta Extender widget Active Trades or the MetaTrader trade overview in the terminal view.
Feel free to get familiar with the remaining widgets!
Tester mode
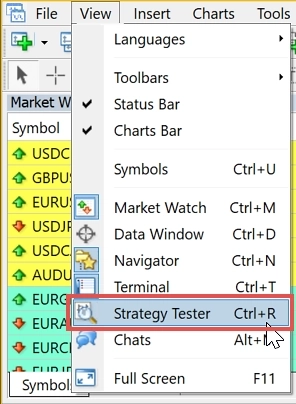
The Meta Extender offers an intriguing use case beyond trading with a live or demo account. It can also be used within the MetaTrader strategy tester. Given that the user interface remains fully operational while running a strategy test, you can practice manual trading in a time-lapse with the help of the strategy tester. Combining the Meta Extender with the MetaTrader strategy tester lets you fast-forward and simulate an entire day in just a few minutes. To explore this feature, please navigate View - Strategy Tester to open the MetaTrader strategy tester.
You will notice a new window appearing at the bottom of your MetaTrader. While the strategy tester is typically used to test fully automated trading strategies, you will now learn to use it for practicing manual trading. This feature could be used to revisit the previous week to practice your understanding of the latest market conditions in a calm moment, such as on a Sunday evening. Another use case is for educational purposes when you want to teach and explain trading to someone without waiting hours to execute trades. Indeed, analyzing a historical chart can be challenging. In retrospect, anyone can place the perfect trade and become a billionaire within weeks. In practice, it’s different. With the strategy tester, you can learn on historical charts with the feeling of an unknown future price.
To use the Meta Extender in tester mode, depending on your MetaTrader version please select the Meta Extender in the strategy tester settings and ensure that the data model is configured to Every tick. This needs the visual mode enabled to access a chart view, in which the Meta Extender can be used. For the start and end date, you can select any day.
Once everything is configured, press the start button and use the Meta Extender in the strategy tester chart view as usual.
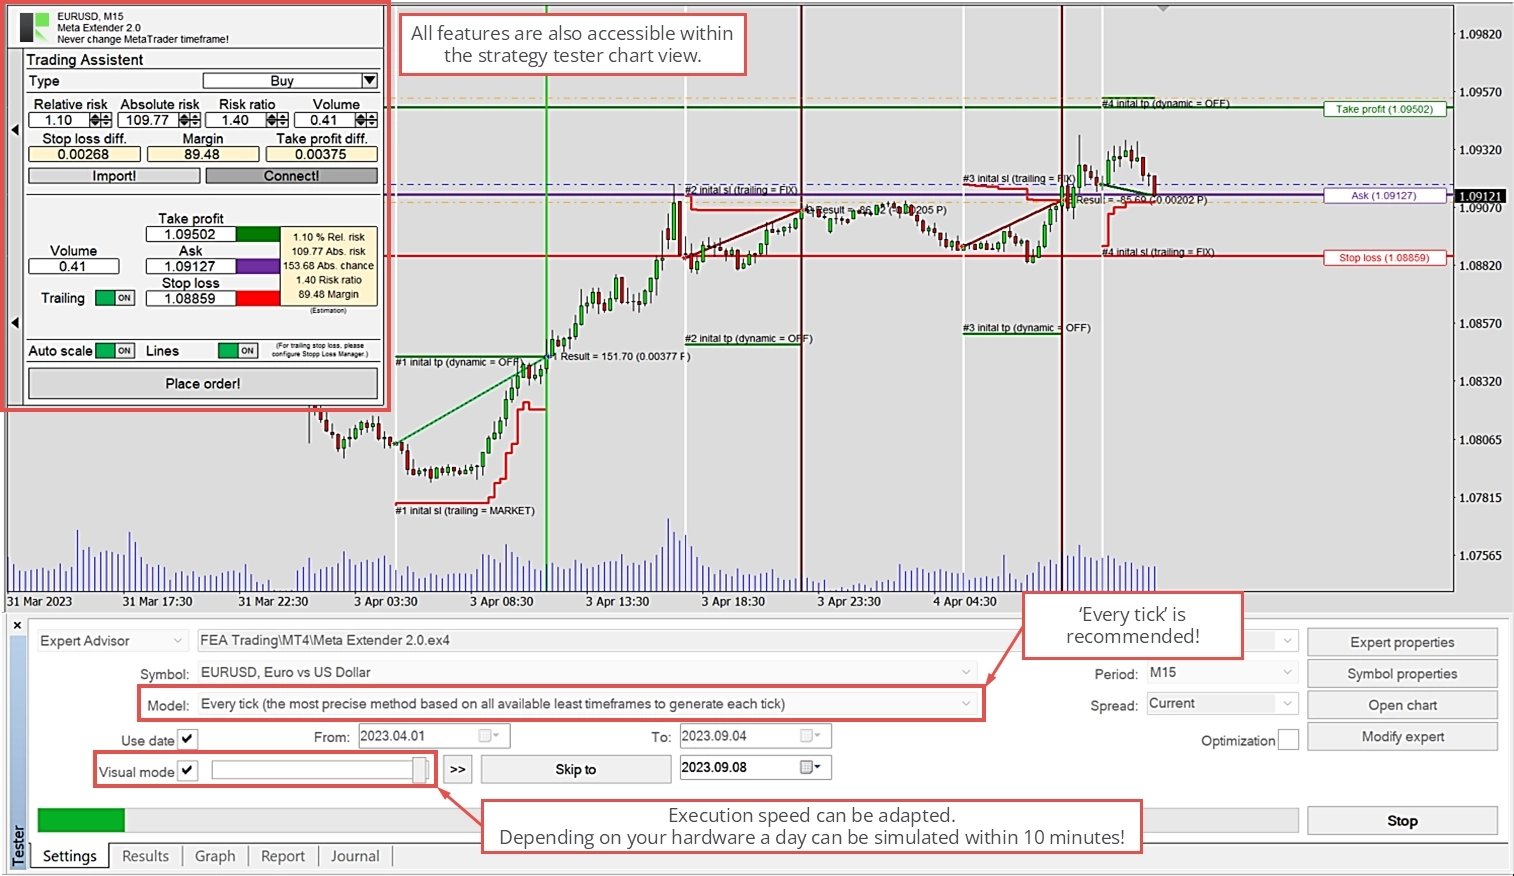
You’ll notice that the simulation can time-lapse a day within a few minutes. If you want to slow down or accelerate the simulation, please adjust the execution speed with the slider.
Need help?
Many common questions are already answered in our frequently asked questions for the Meta Extender. Please take a look there first. If you still need help, our support team is happy to assist.
Uninstall
There are several common ways to uninstall the Meta Extender on Windows:
Via the Start menu (easiest): Open the Windows Start menu, find the Meta Extender in the app list, right-click it, and select Uninstall.
Via Windows Settings: Go to Settings > Apps > Installed apps (on Windows 11) or Settings > Apps > Apps & features (on Windows 10), locate the Meta Extender in the list, click it, and choose Uninstall.
Via the Control Panel: Open the Control Panel and go to Programs > Programs and Features, select the Meta Extender from the list, and click Uninstall.
Any of these methods will completely remove the application from your computer.
Inputs configuration
This chapter provides a detailed explanation of each input parameter, enabling you to configure the Meta Extender to suit your needs. You’ll find all of these settings in the Inputs tab that appears when you start the Meta Extender on a chart. This window may look different in MetaTrader 5, but it functions in principally the same way.
While the default input parameters offer a universally applicable configuration, tailoring the Meta Extender to the specific symbol and timeframe you’re working with is recommended. This might seem daunting initially for beginners, but rest assured, the default parameters are a great starting point. Professional and advanced traders will likely need different input settings for other symbols and timeframes.
To optimize the input parameters, consider using the MetaTrader strategy tester.
MAG - Magic number
Parameters for the magic number
A magic number is a unique identifier that groups all trades initiated by a specific application. In the context of MetaTrader, this is utilized to prevent interference between different applications. For instance, if applications A and B use 123456 and 654321 as their magic numbers, each trade these applications open will be marked with these numbers. Ideally, each application should only modify trades configured with its magic number. The Meta Extender strictly adheres to this rule. While every application compatible with MetaTrader should follow this rule, some do not. For this discussion, we’ll assume that any third-party application you use does adhere to this rule.
| Input variable within MetaTrader | Default value | Comment |
|---|---|---|
| > (MAG) Avoided range start | 100000 | The input value cannot be smaller than 0. |
| > (MAG) Avoided range end | 200000 | The input value cannot be smaller than 0. |
Many third-party applications allow you to specify which magic number should be used. However, the Meta Extender operates on a different principle. Its input parameters > (MAG) Avoided range start and > (MAG) Avoided range end define a range within which a magic number should not be searched and used. Your Meta Extender will automatically search for an available magic number in the remaining number range. All FEA Trading applications follow this principle. To ensure the applications do not use the same magic numbers, a mechanism is in place to prevent a magic number from being used twice.
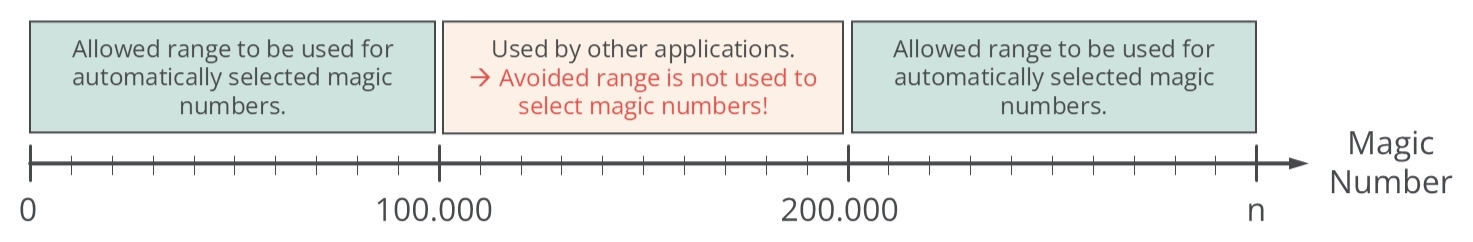
The above illustration explains this principle using a number line. Assuming > (MAG) Avoided range start is set to 100000, and > (MAG) Avoided range end is set to 200000, the actual randomly selected magic number can be any value between 0 - 99999 and above 200000. All applications use 100000 and 200000 as default values, so it is recommended to configure any other third-party application with a dedicated magic number between 100000 and 200000.
SLM - Meta Extender
To optimize the input parameters, consider using the tester mode. Refer to the related article to familiarize yourself with this feature of the Meta Extender.
Parameters for breakeven trailing
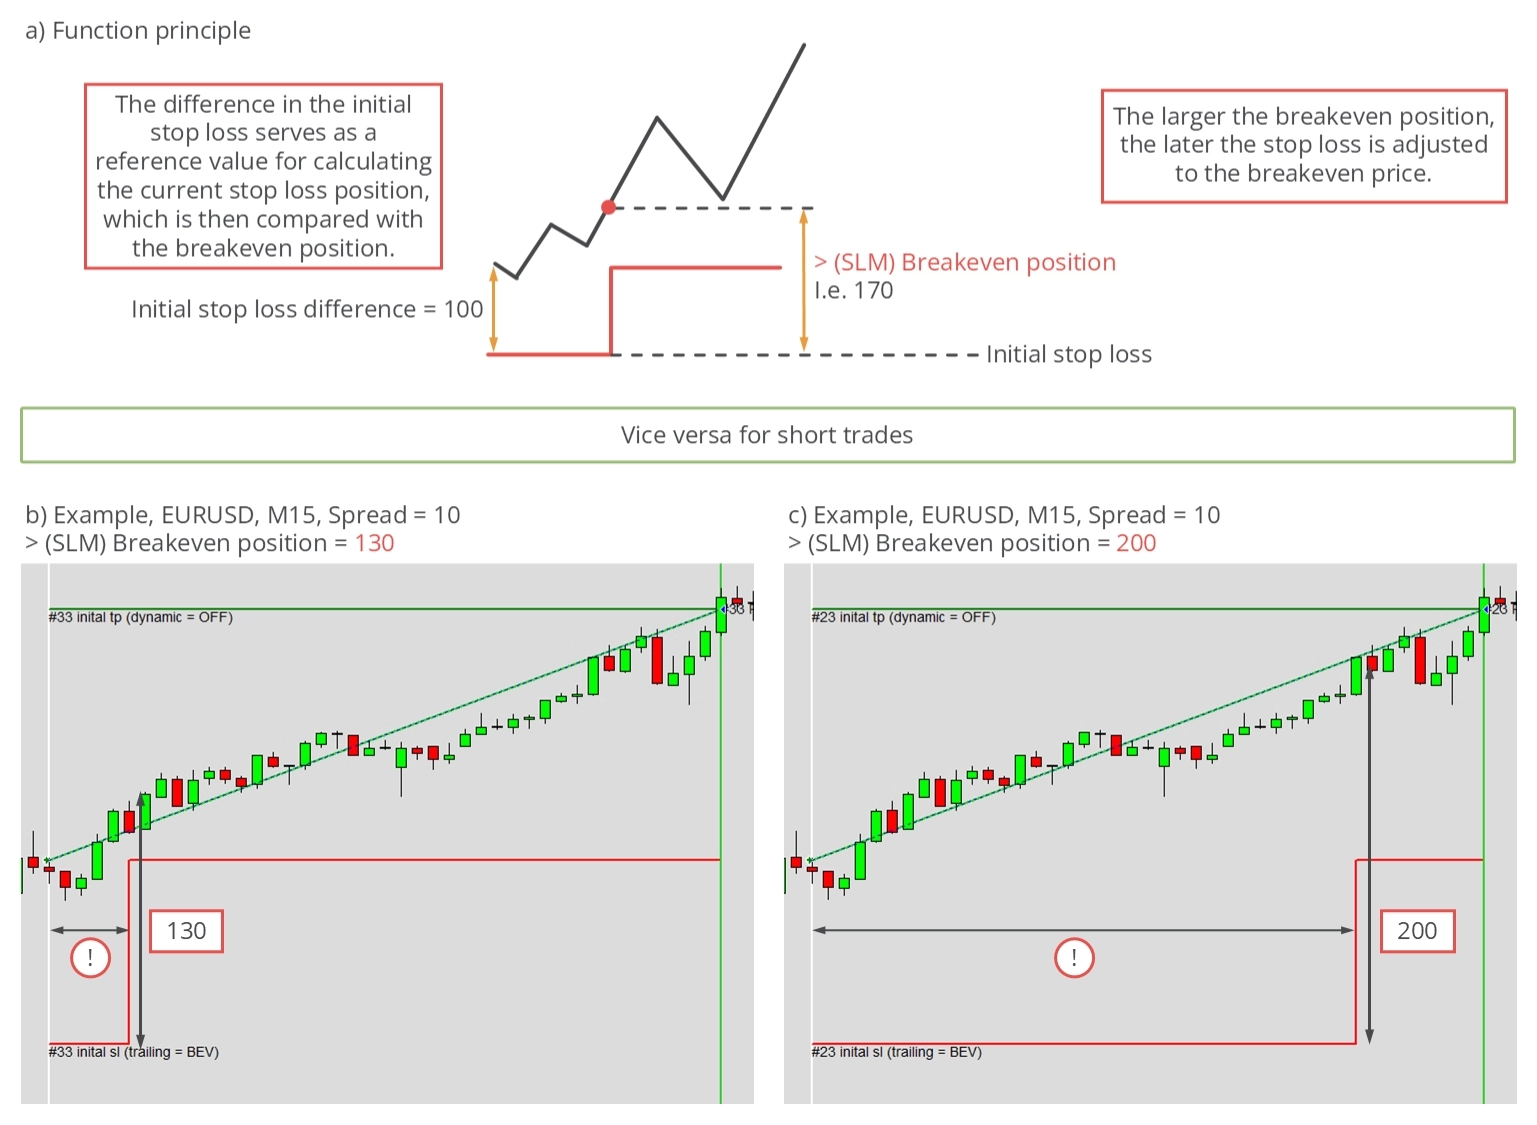
The breakeven trailing method implies that the stop loss value is only modified once at a specific price. This ensures that already-made profits are secured. The sudden jump in stop loss will occur when the trade is already in a respectable profitable zone, and it’s not expected that the trade will change its direction.
| Input variable within MetaTrader | Default value | Comment |
|---|---|---|
| > (SLM) Breakeven position | 130 | The input value cannot be smaller or equal to 0. |
You can use the Breakeven position input parameter to define the moment when the jump will occur. The initial distance between the opening price and initial stop loss represents the reference value 100. Let’s assume this was 80 pips. If the > (SLM) Breakeven position is set to 150, the jump to breakeven will occur when the price rises 40 pips above the opening price. As seen in the illustration below, the larger the breakeven position, the later the jump.
DANGER
This trailing method should only be used with a take profit or by manual supervision and closing the trade. Since the stop loss value never changes again, the maximum outcome will be zero profit. Fees such as commission or swap are not included in the calculation of the breakeven price.
Parameters for market trailing
Market trailing doesn’t rely on complex algorithms. Instead, it uses the open and close prices of the previous candle sticks, combined with the spread, to calculate its movements. The only adjustable variable is a buffer added to the stop loss distance. This buffer can be calculated by two parameters: a fixed value measured in pips (> (SLM) Market buffer fix) or/and a dynamic value based on the current spread (> (SLM) Market buffer spread).
| Input variable within MetaTrader | Default value | Comment |
|---|---|---|
| > (SLM) Market buffer fix | 5.0 | This parameter introduces a buffer to the stop loss level, calculated based on a fixed number of pips. The input value cannot be smaller or equal to 0. |
| > (SLM) Market buffer spread | 4.0 | This parameter introduces a buffer to the stop loss level, calculated based on a fixed number of pips. However, in this case, the parameter multiplies the current spread value. The product of this multiplication determines the buffer level. The input value cannot be smaller or equal to 0. |
Based on the spread, the dynamic option is handy to avoid being stopped during night hours. For instance, the ask price is crucial for long trades to define when a trade will close. However, the stop loss level might come too close if the spread is too large. Therefore, during phases of large spread, the market trailing variant can automatically adapt the buffer to better react in volatile phases or during night hours.
The effect of the input parameter can be observed in the chart below.
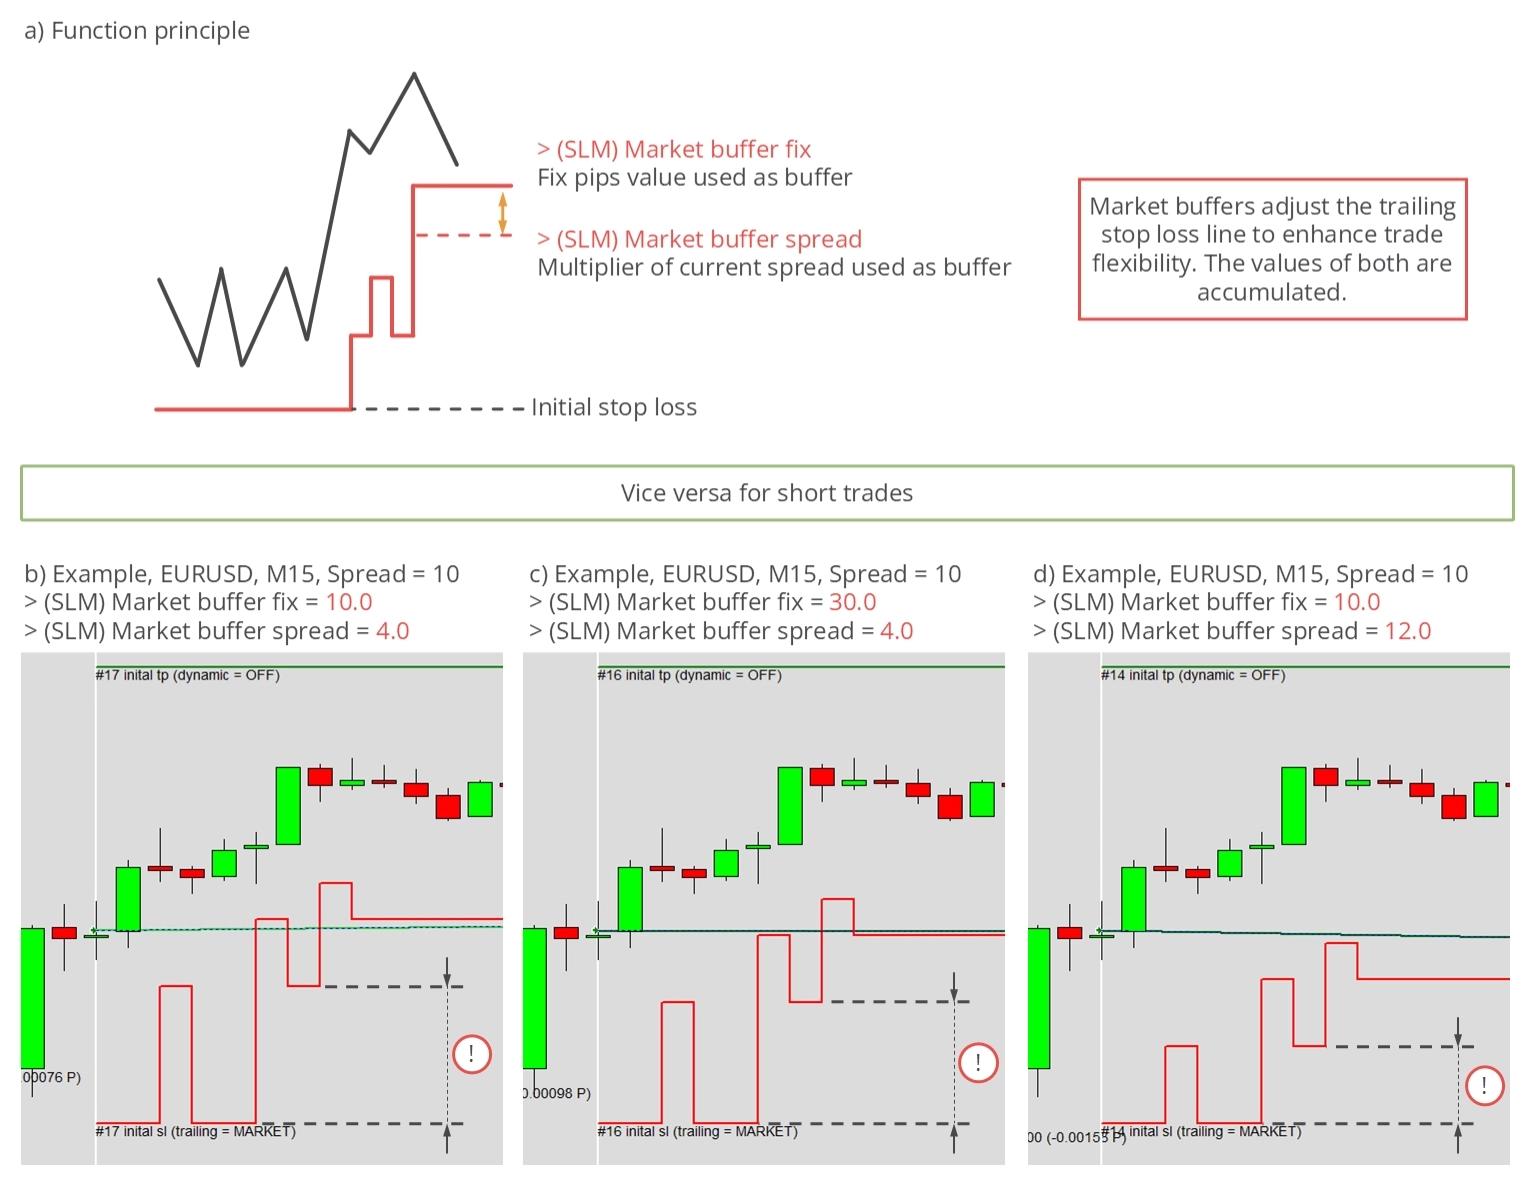
As can be seen, both parameters move the stop loss line further away from the actual price. Both buffer types can be combined freely. If used together, their values will be added to each other.
Parameters for average true range trailing
The average true range (ATR) trailing method employs an ATR indicator to calculate the stop loss distance. This widely used indicator is a standard tool for assessing a price chart’s volatility.
| Input variable within MetaTrader | Default value | Comment |
|---|---|---|
| > (SLM) ATRS multiplier | 3.5 | The input value cannot be smaller or equal to 0. |
| > (SLM) ATRS period | 14 | The input value cannot be smaller or equal to 0. |
The parameters for configuring the ATR trailing method include the > (SLM) ATRS period, the period used to calculate the ATR indicator, and the > (SLM) ATRS multiplier. The raw ATR value is typically too small to be used as a trailing stop loss distance, so it’s common to multiply the raw indicator value with a multiplier. A frequently used value for the multiplier is 3.5.
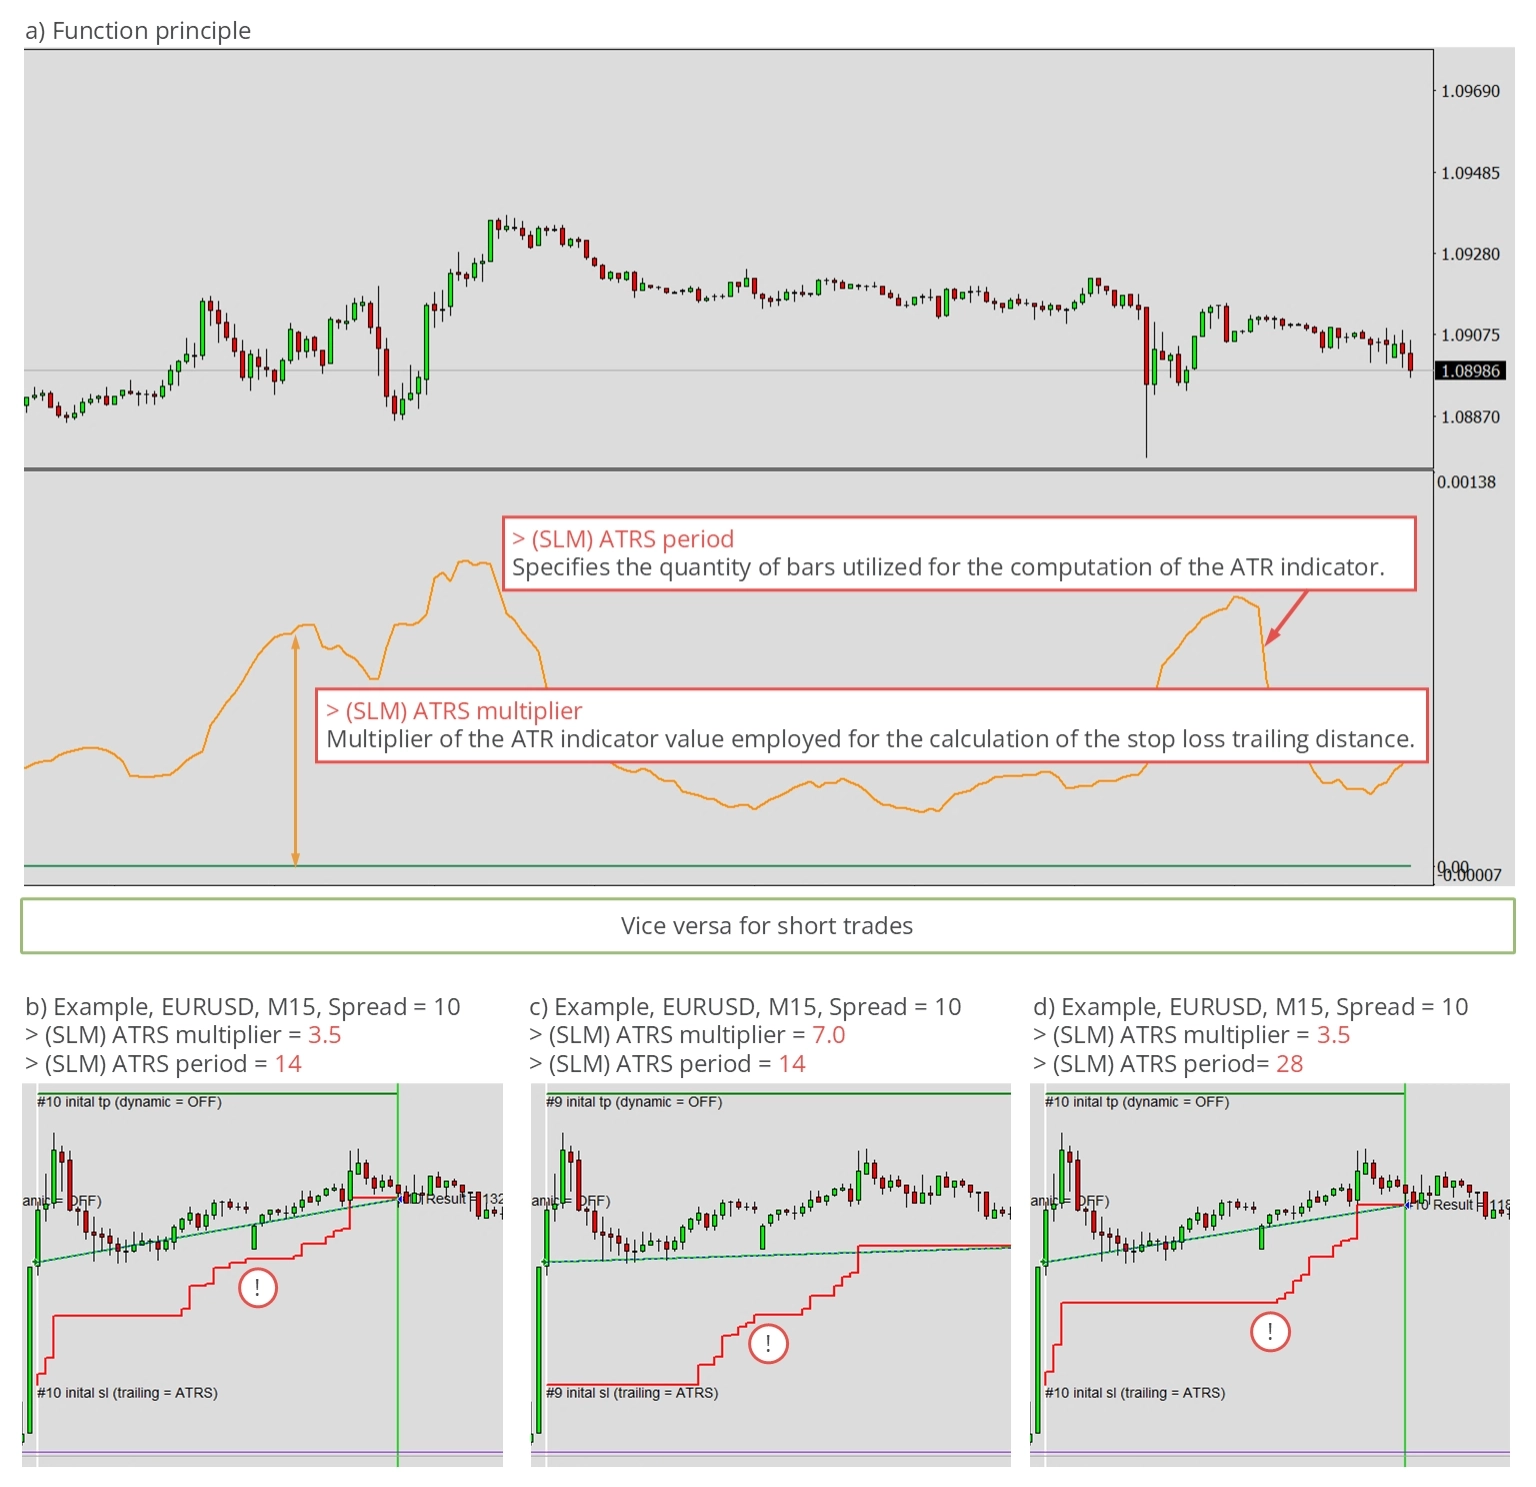
By adjusting these values, the ATR trailing method can respond more to the current price.
Parameters for parabolic SAR trailing
Parabolic SAR trailing stop losses utilize a PSAR indicator, another standard tool in modern trading. This indicator usually comes with two input parameters.
| Input variable within MetaTrader | Default value | Comment |
|---|---|---|
| > (SLM) PSAR step | 0.02 | The input value cannot be smaller or equal to 0. |
| > (SLM) PSAR maximum | 0.2 | The input value cannot be smaller or equal to 0. |
The PSAR value is directly taken as the stop loss, depending on whether the current PSAR value qualifies. Since the PSAR is drawn above or below the price chart, there are phases when the PSAR does not output valid values for stop losses. This typically happens when a trade is opened. When the PSAR changes its characteristic, the stop loss may move quickly close to the price. The input parameters > (SLM) PSAR step and > (SLM) PSAR maximum are used to adapt this movement.
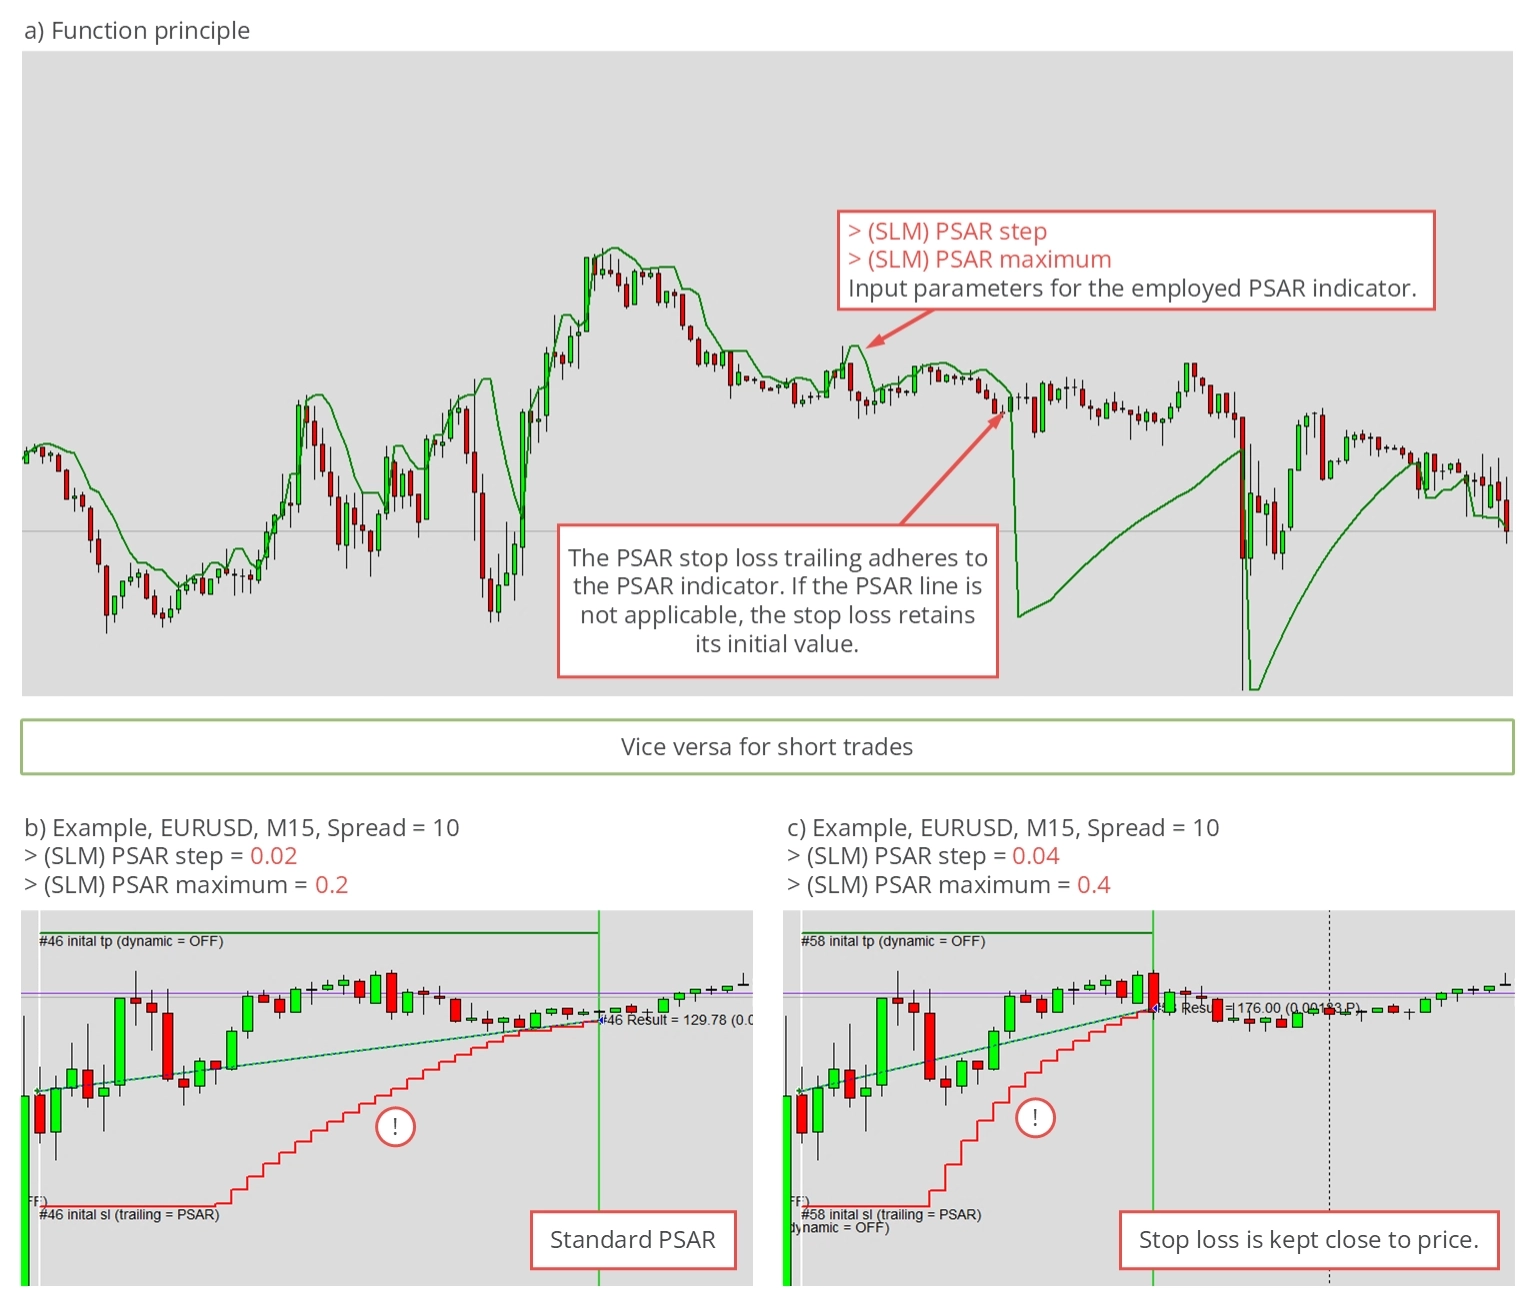
The lower these values are, the more gently the stop loss moves towards the price value.
Parameters for stepwise trailing
The stepwise trailing method incrementally moves the stop loss closer to the current price. Each step is of equal size, and the next step is executed when the price increases by a specified value. As is customary in this application, the input parameters for this trailing method are defined with relative parameters. In this case, the initial stop loss difference, the price difference between the opening price and the initially configured stop loss, represents the unitless reference value of 100.
| Input variable within MetaTrader | Default value | Comment |
|---|---|---|
| > (SLM) Steps size | 80 | The input value cannot be smaller or equal to 0 and not greater than or equal 100. |
| > (SLM) Steps position | 130 | The input value cannot be smaller or equal to 100. |
The input parameter > (SLM) Steps size determines the size of each step, while > (SLM) Steps position indicates when the next step will be executed. As previously mentioned, both values are relative. For instance, if the initial stop loss difference is 100 pips and > (SLM) Steps size is set to 130, the next step will occur when the price reaches initial stop loss + 130 pips. Subsequently, the next step will be executed at initial stop loss + 260 pips. This pattern will continue until the trade is eventually stopped out.
If > (SLM) Steps position is set to 80, the stop loss value will increase to initial stop loss value + 80 pips at the first step and to initial stop loss value + 160 pips at subsequent steps. This pattern will also repeat until the trade is stopped out.
The illustration below demonstrates the function principle and provides two examples of the operation of this stop loss trailing method.
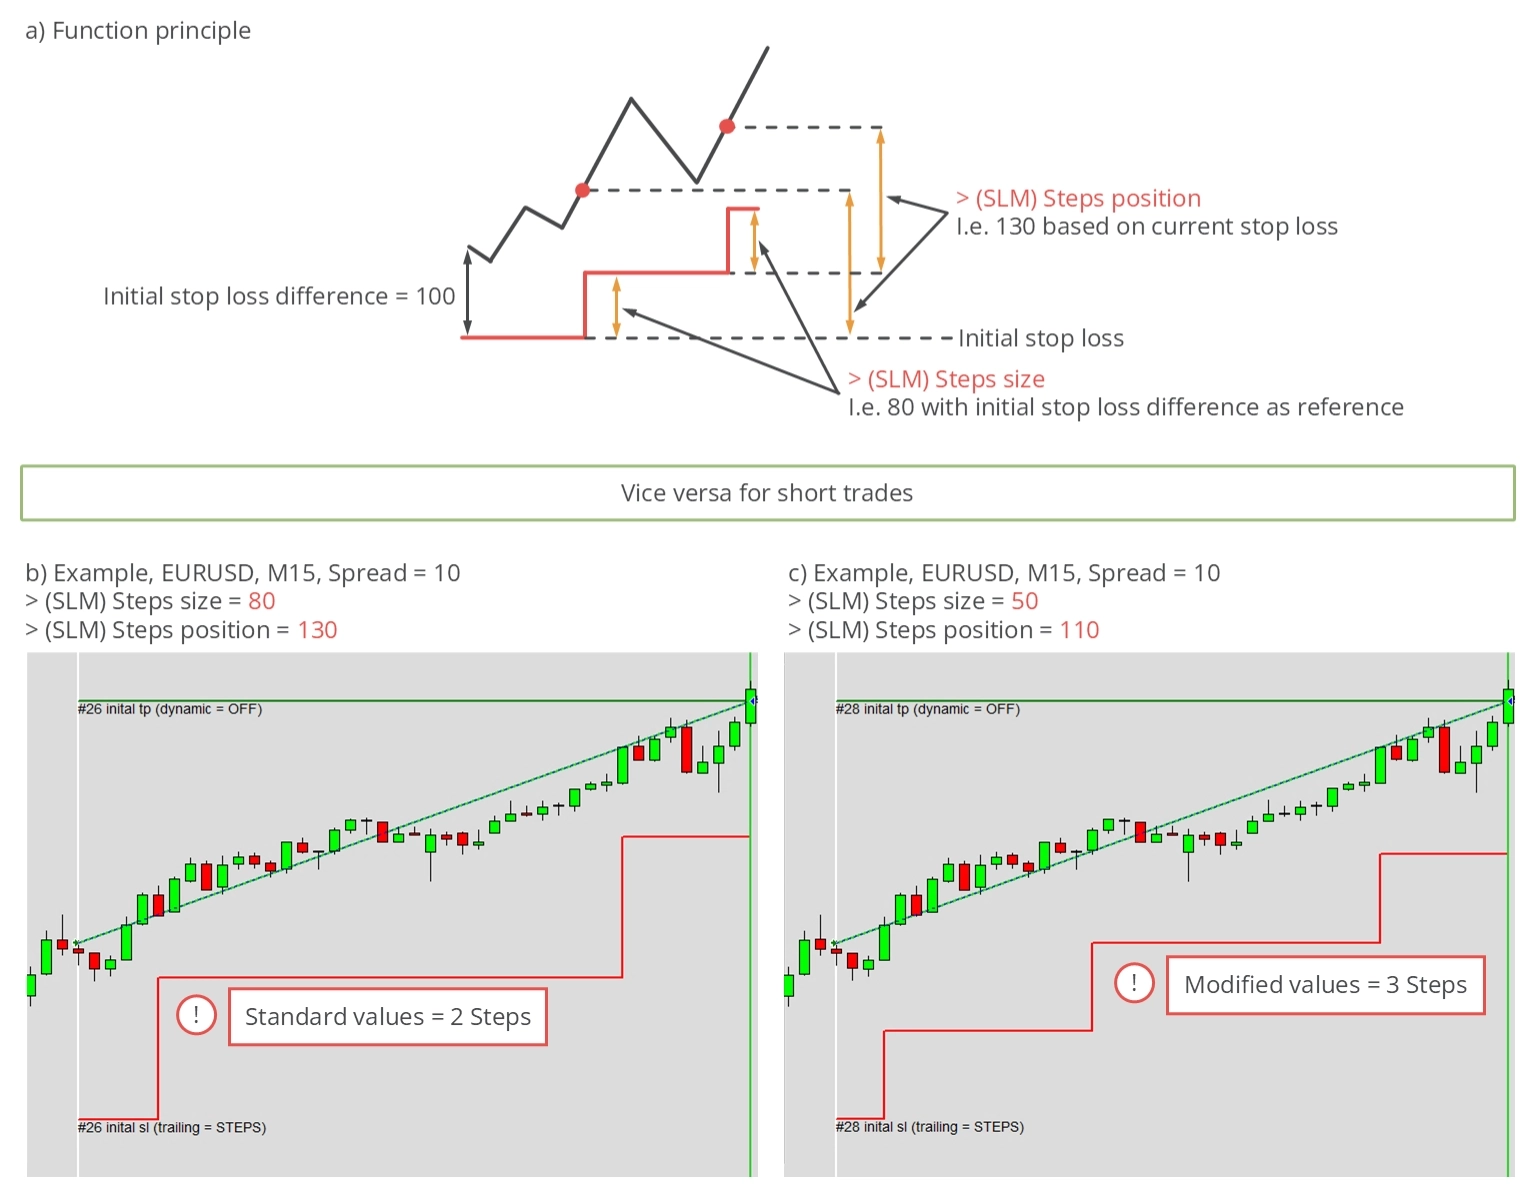
Please note that > (SLM) Steps position cannot be less than 100, and > (SLM) Steps size cannot exceed 100. Setting both values close to their minimum or maximum input value makes the steps more frequent. The time interval between the two steps depends on the actual price movement, which triggers the stop loss to jump to the next step.
Parameters for time based trailing
Another method for managing the stop loss is a time-based trade closure. Technically, this doesn’t constitute trailing since the stop loss value remains unchanged. Instead, when this method is selected, the trade will be closed after a predetermined time, irrespective of its current performance.
| Input variable within MetaTrader | Default value | Comment |
|---|---|---|
| > (SLM) Time count | 15 | Positive values represent the period, measured in bars, in the currently active timeframe. On the other hand, negative values represent the period measured in seconds. |
The period is determined by the input parameters > (SLM) Time count and can be utilized in two ways. Positive values represent the period measured in bars in your current timeframes. For instance, if the value is set to 10 and you’re trading in the M5 timeframe, the trade will be closed after 50 minutes. Conversely, negative values represent the period measured in seconds. A value of -3600 indicates that the trade will be closed precisely 60 minutes after it’s opened, while -7200 signifies a closure time of 120 minutes after the trade is opened. The following illustration demonstrates the function principle and provides two examples of positive values for > (SLM) Time count.
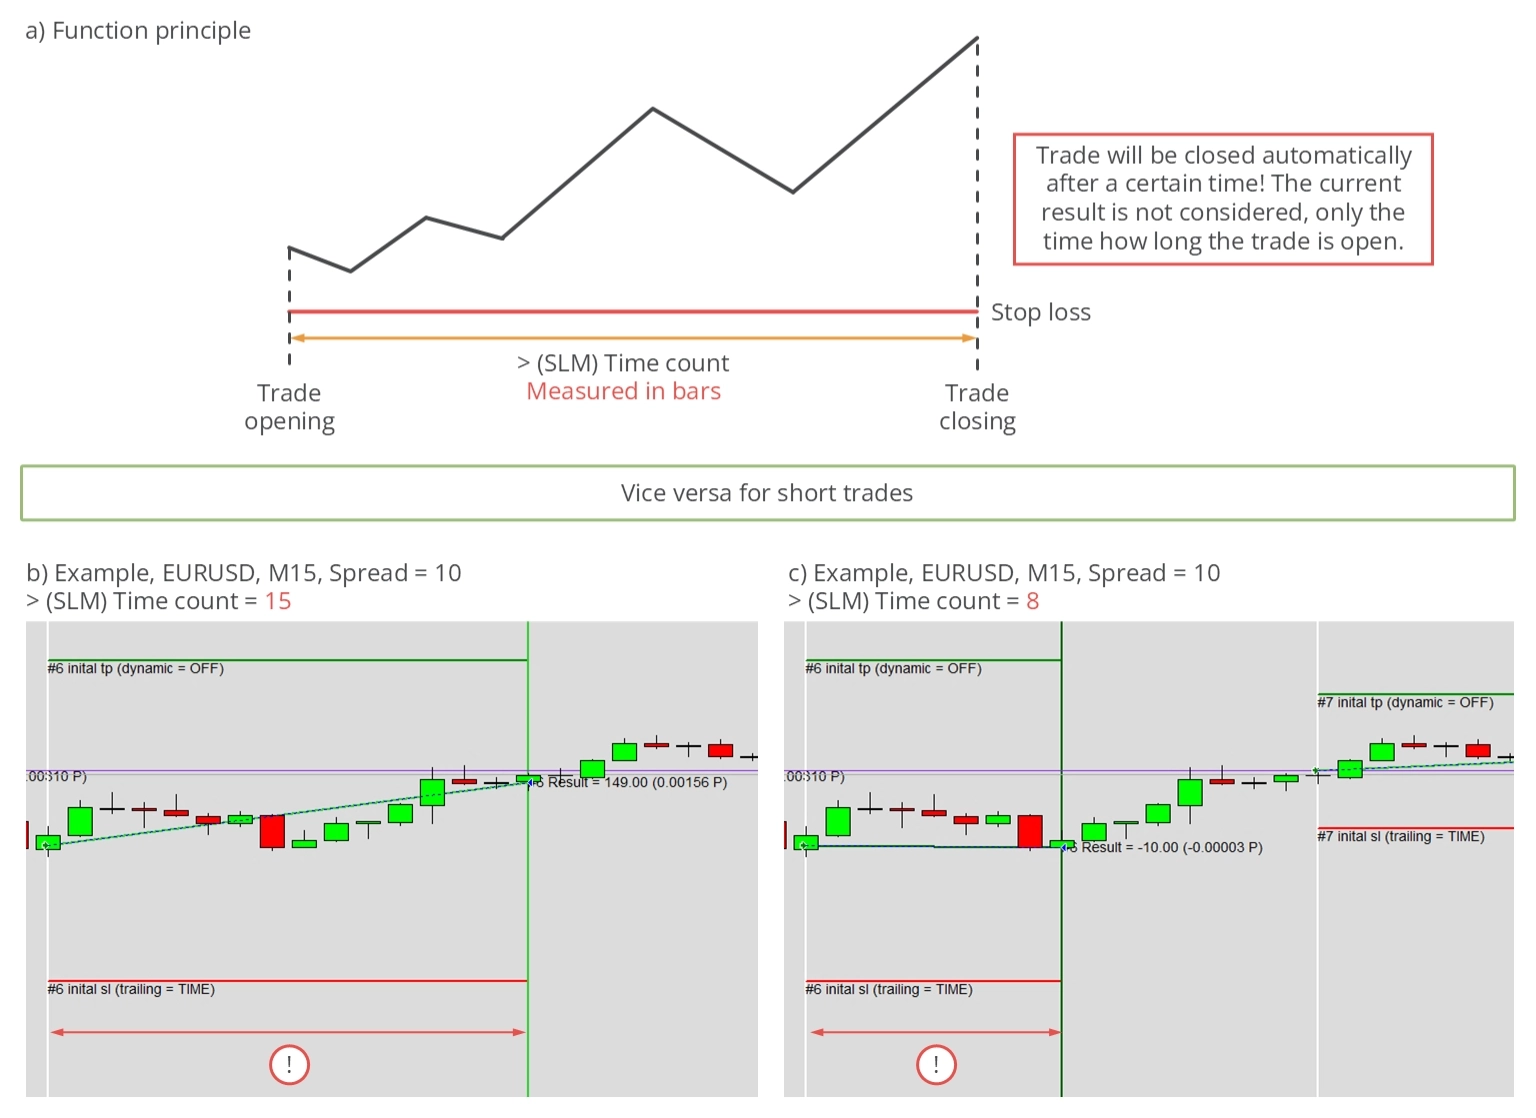
As illustrated, the stop loss value remains unchanged in both examples.
Parameters for linear steps trailing
The linear steps stop loss trailing method increases the stop loss after each bar in the currently active timeframe, resulting in a strictly linear rise in the stop loss value.
| Input variable within MetaTrader | Default value | Comment |
|---|---|---|
| > (SLM) Linear step | 5 | The input value must be greater than 0. Lower values might result in a static stop loss, as the smallest price increment could be larger than the desired step size. |
As is customary, the initial stop loss distance is determined by the difference between the opening price and the initial stop loss. This value represents the unitless value of 100. The only input parameter for this trailing method is the step size, defined by > (SLM) Linear step. The default value is 5, meaning the stop loss will increase by 0.5% x the initial stop loss difference after each closed bar. For instance, if the initial stop loss difference was 1000 pips, the stop loss level will increase by five pips after every closed bar. The increment might be tiny in some timeframes and initial stop loss values, so the next step could be smaller than the smallest increment for changing the stop loss.
The following illustration briefly explains the function principle and visualizes it with two examples.
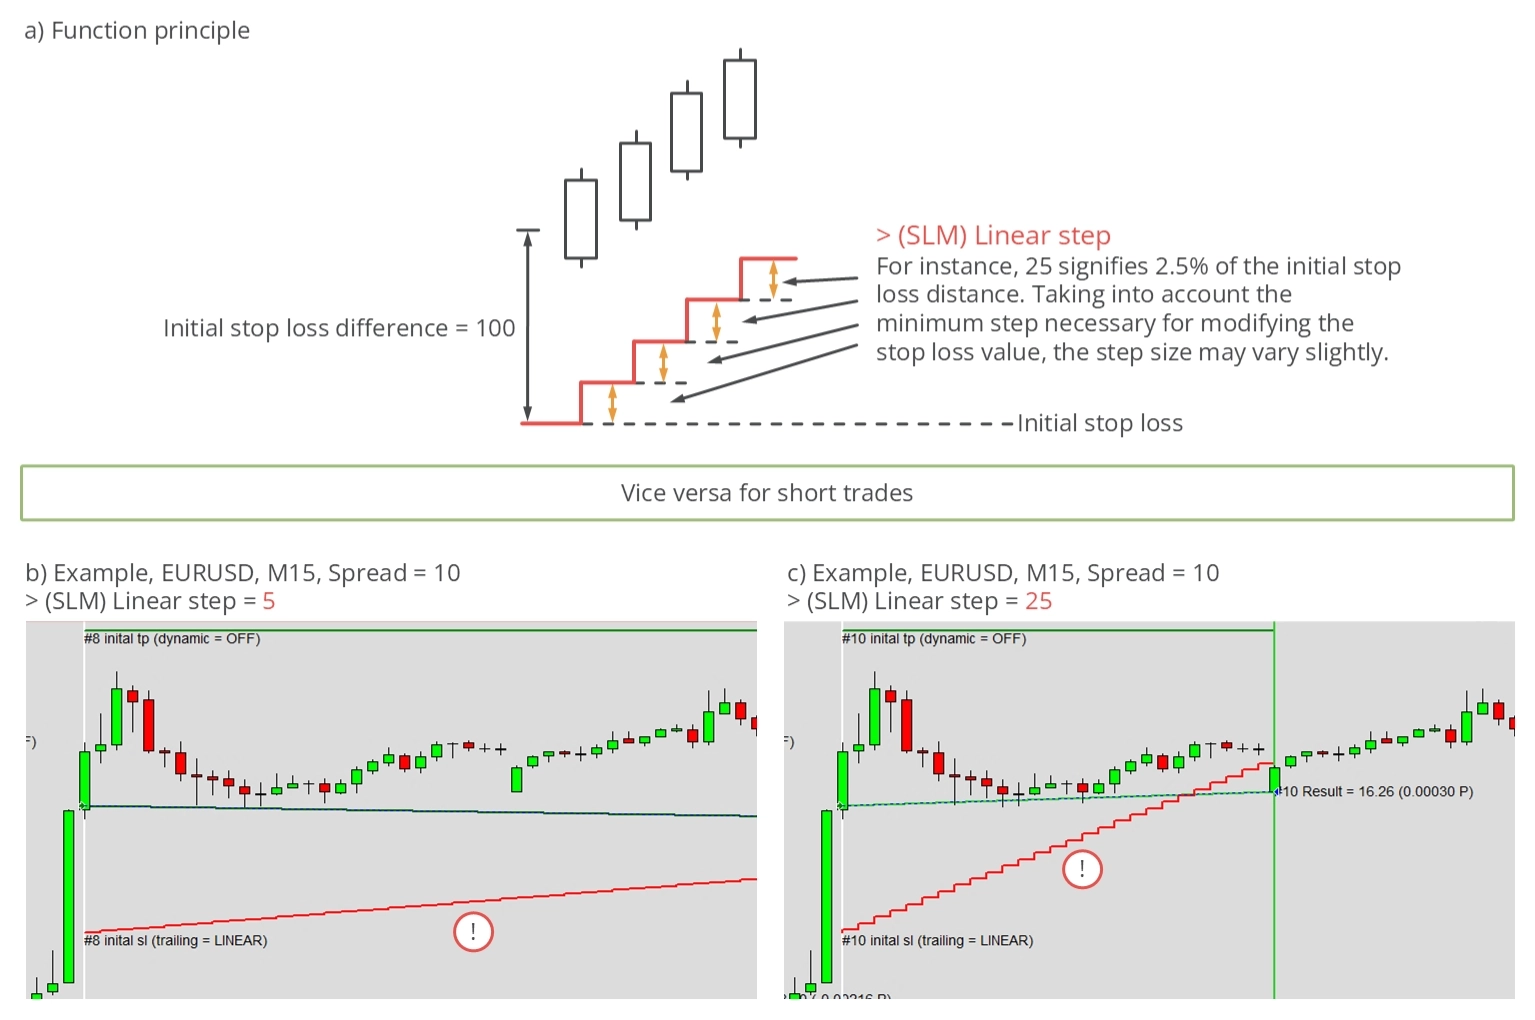
The value must be greater than 0.
Parameters for HiLo trailing
With the HiLo trailing method, the stop loss is set to the lowest local low or highest local high, depending on the direction of the trade. The lowest local low within a certain period, measured in bars, is used for long trades. The stop loss value is adjusted if a higher local low appears within the observed period. There’s no limit to how often the stop loss value can change, but it can only increase for long trades. The function principle for short trade is vice versa.
| Input variable within MetaTrader | Default value | Comment |
|---|---|---|
| > (SLM) HiLo period | 20 | The input value cannot be smaller or equal to 0. |
The only variable that affects this trailing method is the observed period, defined by > (SLM) HiLo period. This value specifies the number of bars preceding the current time. The larger the value, the further the stop loss is typically from the price chart. The illustration below demonstrates the function principle and provides some examples.
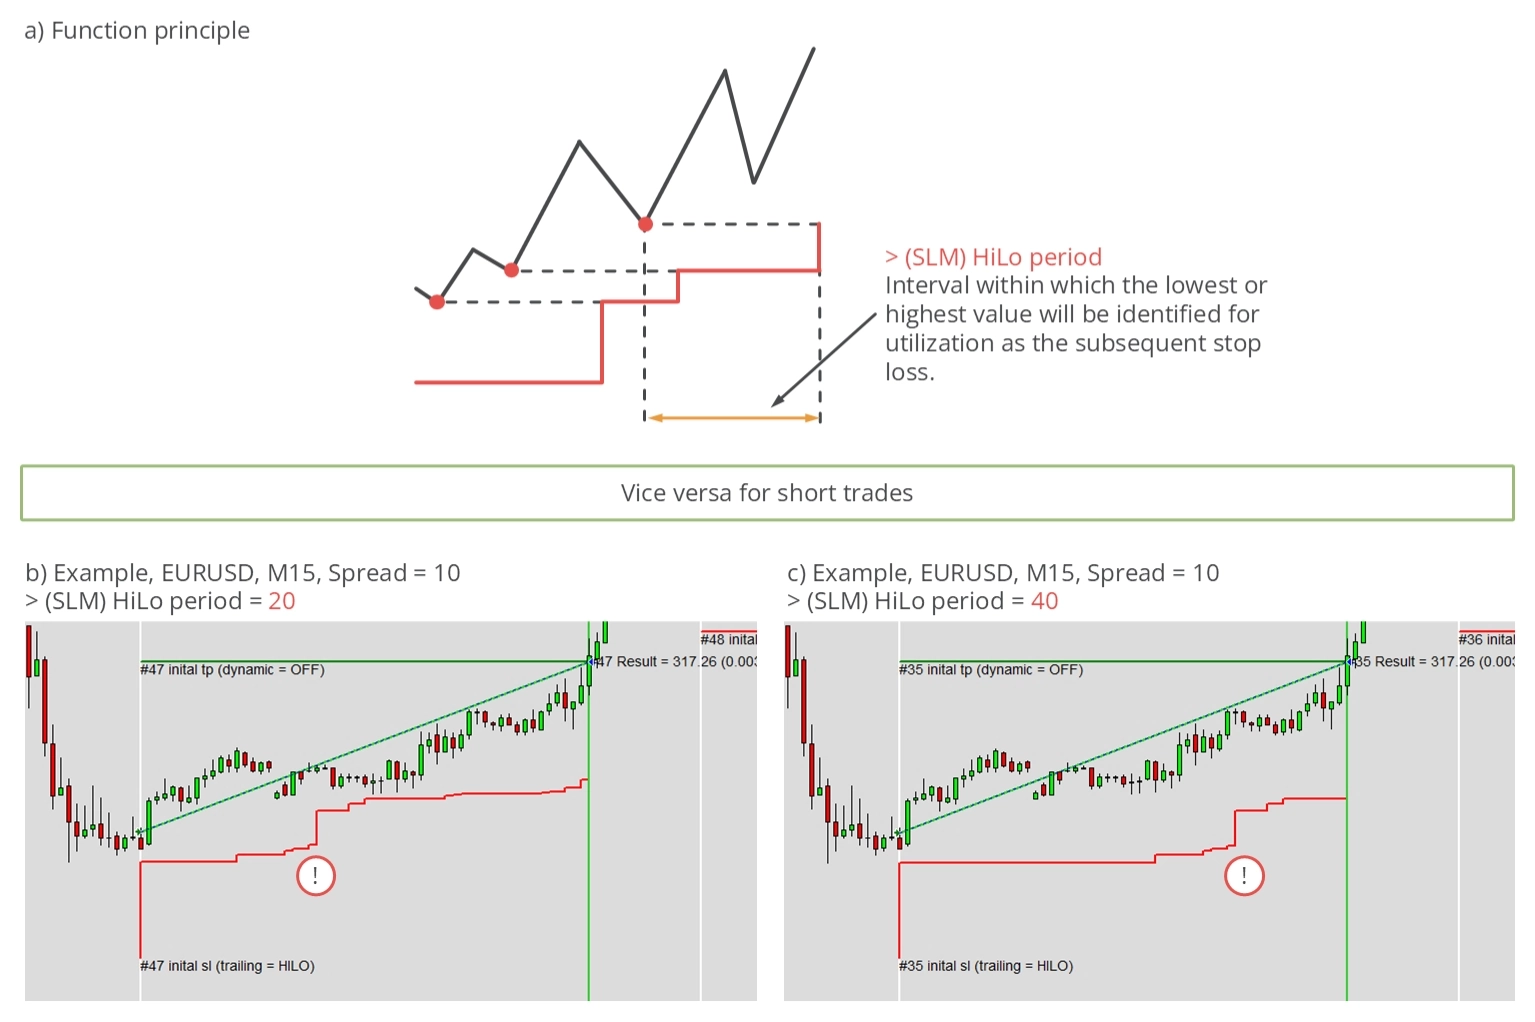
As shown, all examples illustrate trades made in a long direction. For short trades, the behavior is reversed. This trailing method often aligns with previous short-term support and resistance values.
ISP - Inspector
The inspector calculates performance, drawdown, and statistics in real time based on closed and currently open trades. Performance and drawdown are computed for the current day, week, month, year, and since the start of the application. The values for specific periods are reset at the beginning of each period. For instance, the daily drawdown and performance are reset at midnight each day, and the weekly performance output is reset at the transition from Saturday to Sunday. These features allow you to verify your trading strategy’s performance and drawdown quickly and precisely.
The widget outputs are as follows.
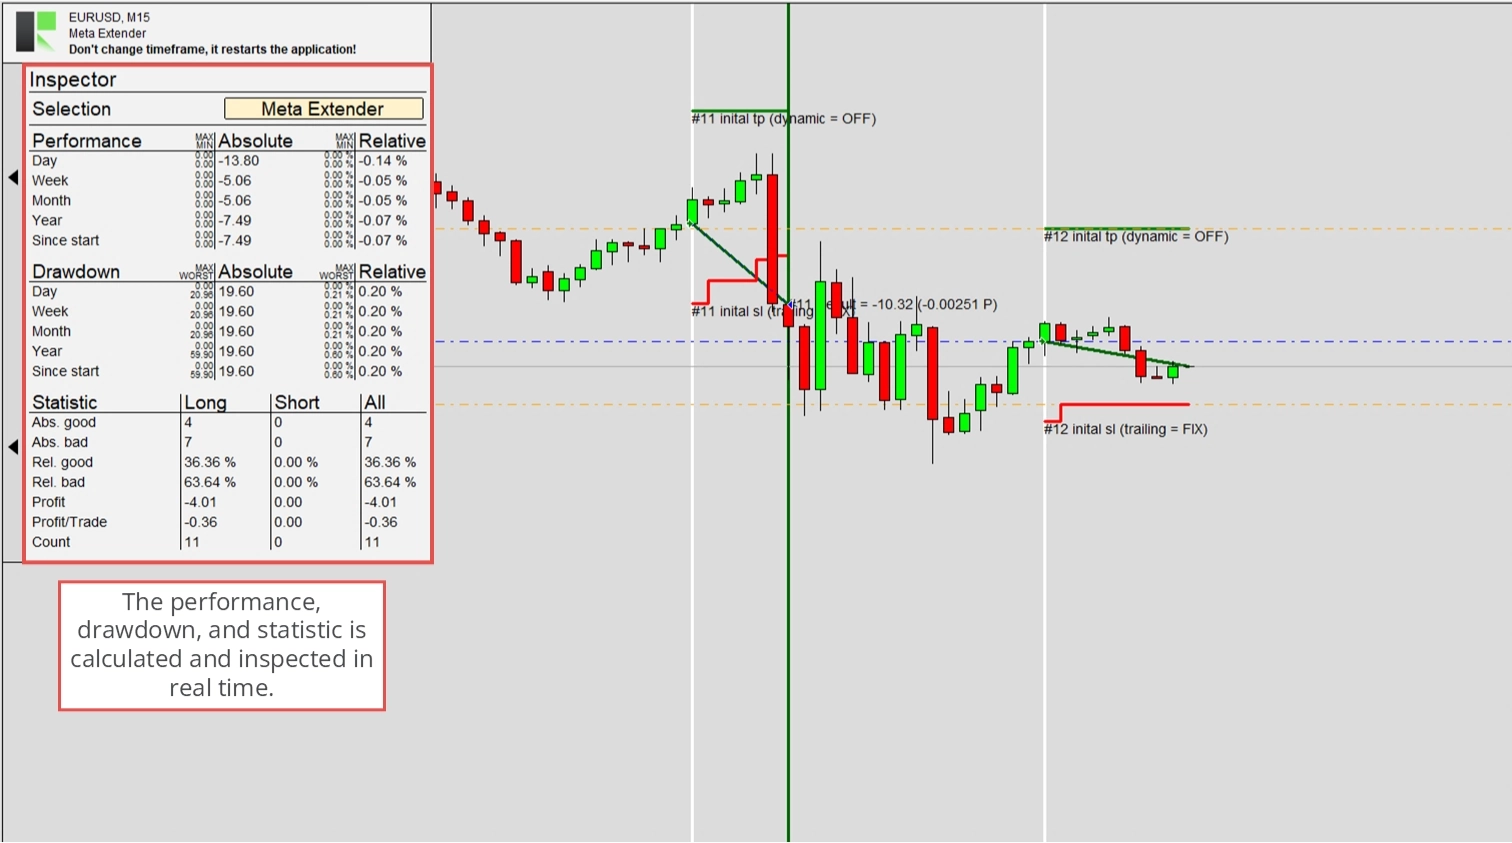
Drawdown and performance are calculated as both absolute and relative values. Alongside each output, max, min, and worst values are displayed, which indicate configured limits or the worst value for drawdown in the given period. A limit signifies that all trading will be deactivated when the performance or drawdown reaches it. This helps to reduce losses and maintain awareness of your success.
Various input parameters allow you to configure maximum and minimum values and to automatically turn off the option to open further trades once the limit value is reached. Depending on the observed orders, this will turn off the trading possibility with the Meta Extender or the entire MetaTrader.
Observed orders
The observed orders can vary: the Meta Extender can observe all trades opened with the Meta Extender, opened on the same symbol the MetaTrader is active, or all trades opened with your MetaTrader instance, regardless of the symbol.
| Input variable within MetaTrader | Default value | Comment |
|---|---|---|
| > (ISP) Observer selection | Meta Extender | Options: -Meta Extender -Symbol -MetaTrader |
To define the trades that will be considered for calculating and updating the inspector screen, you can use the > (ISP) Observer selection input parameters. An Inspector session starts at zero when the application starts, meaning the Meta Extender should run continuously for consistent supervision. While this might be impractical with a home computer, it is straightforward and convenient with a VPS solution.
Changes to the observer selection can only be made at the start of the Meta Extender. When Symbol or MetaTrader is selected as the observer selection, and a limit is reached, the MetaTraders AutoTrading option will be disabled. When Meta Extender is set, only the ability to place new orders with the Trading Assistant and Trendline Trading widgets is disabled.
Performance - Daily protection
The inspector engine can be configured to halt trading once a specified daily performance limit is reached using the input parameters outlined in the table below. These parameters establish the daily absolute and relative minimum and maximum thresholds. A value of zero effectively turns off the limit.
| Input variable within MetaTrader | Default value | Comment |
|---|---|---|
| > (ISP) Performance day abs min (0.0 -> OFF) | 0.0 | If the account equity is at $10,000 and the minimum value is set at -100, trading will be suspended if the equity falls below $9,900. Trading will resume at the beginning of the next day, with the equity at that moment used as the new reference point. The input value cannot be greater than 0. |
| > (ISP) Performance day abs max (0.0 -> OFF) | 0.0 | If the account equity is at $10,000 and the minimum value is set at 100, trading will be suspended if the equity rises above $10,100. Trading will resume at the beginning of the next day, with the equity at that moment used as the new reference point. The input value cannot be smaller than 0. |
| > (ISP) Performance day rel min (0.0 -> OFF) | 0.0 | If the account equity is at $10,000 and the minimum value is set at -0.15, trading will be suspended if the equity falls below $9,850. The value will be reset, and trading will be reactivated at the next day’s start. The equity at the beginning of the next period serves as a new reference value to calculate the performance limits. The input value cannot be greater than 0. |
| > (ISP) Performance day rel max (0.0 -> OFF) | 0.0 | If the account equity is at $10,000 and the minimum value is set at 0.15, trading will be suspended if the equity rises above $10,150. The value will be reset, and trading will be reactivated at the next day’s start. The equity at the beginning of the next period serves as a new reference value to calculate the performance limits. The input value cannot be smaller than 0. |
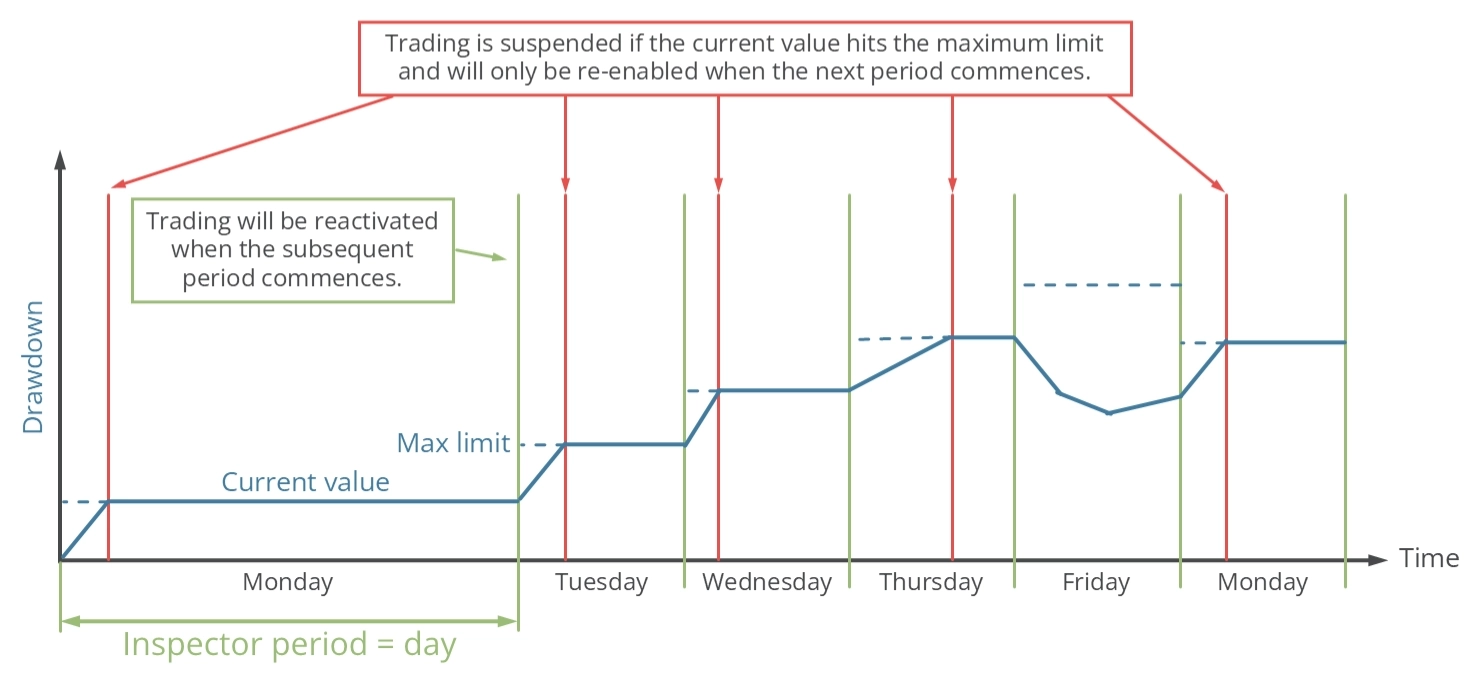
Separate input parameters exist for the maximum and minimum permissible performance results. This allows the application to suspend the initiation of new trades when positive or negative performance results are achieved. The diagram below elucidates the operational principle of daily inspector protection.
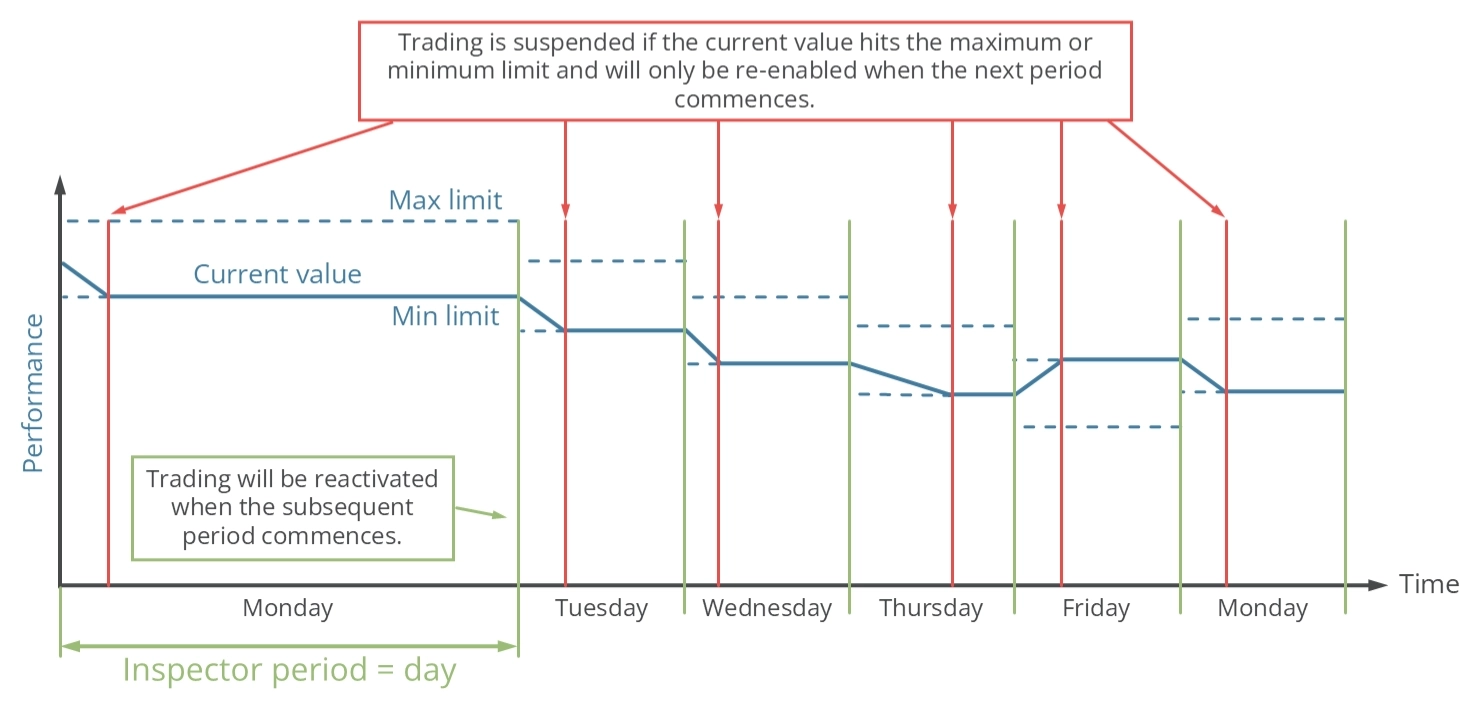
The inspection period is set to one day. If the performance reaches the maximum or minimum value within this period, the ability to open new trades will be temporarily suspended. At the start of a new period, which is at midnight, the performance value for the day is reset, and trading resumes. This cycle continues indefinitely.
Performance - Weekly protection
The inspector engine can be configured to halt trading once a specified weekly performance limit is reached using the input parameters outlined in the table below. These parameters establish the weekly absolute and relative minimum and maximum thresholds. A value of zero effectively turns off the limit.
| Input variable within MetaTrader | Default value | Comment |
|---|---|---|
| > (ISP) Performance week abs min (0.0 -> OFF) | 0.0 | If the account equity is at $10,000 and the minimum value is set at -100, trading will be suspended if the equity falls below $9,900. Trading will resume at the beginning of the next week, with the equity at that moment used as the new reference point. The input value cannot be greater than 0. |
| > (ISP) Performance week abs max (0.0 -> OFF) | 0.0 | If the account equity is at $10,000 and the minimum value is set at 100, trading will be suspended if the equity rises above $10,100. Trading will resume at the beginning of the next week, with the equity at that moment used as the new reference point. The input value cannot be smaller than 0. |
| > (ISP) Performance week rel min (0.0 -> OFF) | 0.0 | If the account equity is at $10,000 and the minimum value is set at -0.15, trading will be suspended if the equity falls below $9,850. The value will be reset and trading will be reactivated at the start of the following week. The equity at the beginning of the next period serves as a new reference value to calculate the performance limits. The input value cannot be greater than 0. |
| > (ISP) Performance week rel max (0.0 -> OFF) | 0.0 | If the account equity is at $10,000 and the minimum value is set at 0.15, trading will be suspended if the equity rises above $10,150. The value will be reset and trading will be reactivated at the start of the following week. The equity at the beginning of the next period serves as a new reference value to calculate the performance limits. The input value cannot be smaller than 0. |
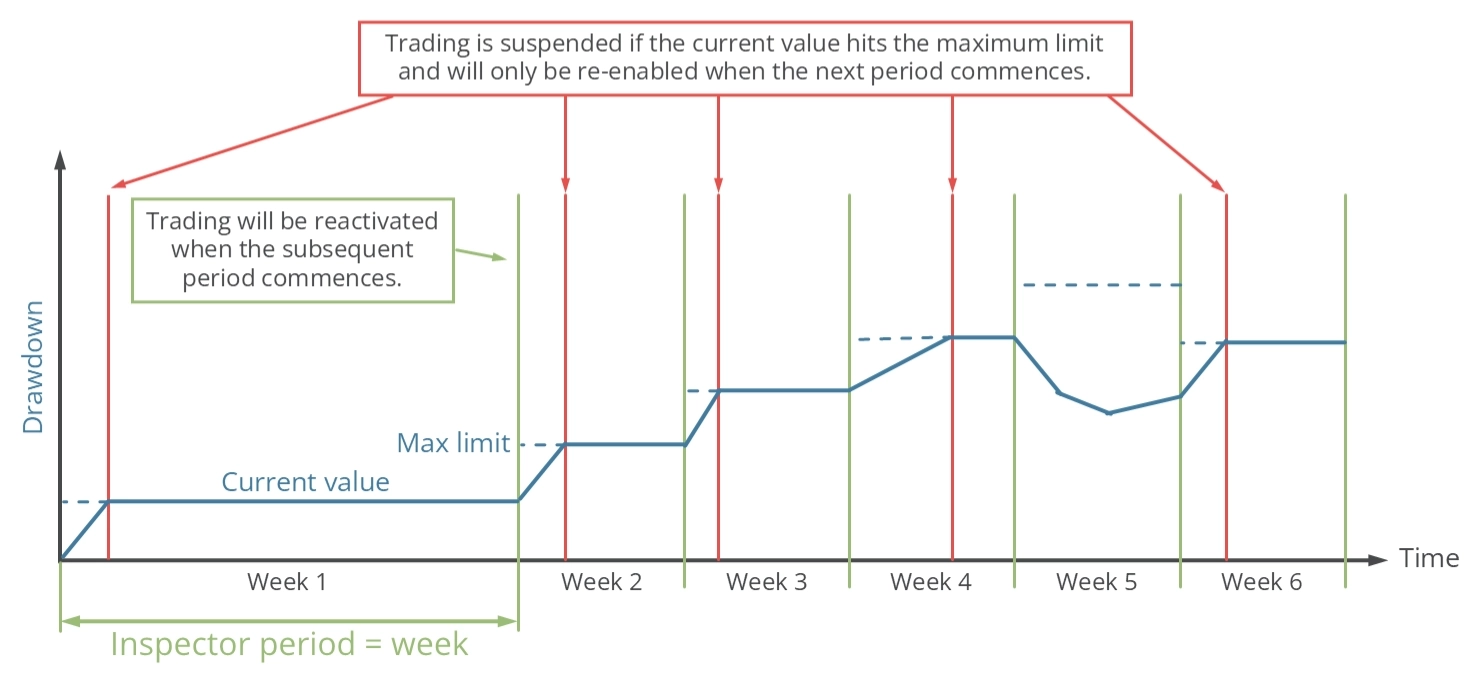
Separate input parameters exist for the maximum and minimum permissible performance results. This allows the application to suspend the initiation of new trades when positive or negative performance results are achieved. The diagram below elucidates the operational principle of weekly inspector protection.

The inspection period is set to one week. If the performance reaches the maximum or minimum value within this period, the ability to open new trades will be temporarily suspended. At the start of a new period, which is midnight between Saturday and Sunday, the performance value for the week is reset, and trading is resumed. This cycle continues indefinitely.
Performance - Monthly protection
The inspector engine can be configured to halt trading once a specified monthly performance limit is reached using the input parameters outlined in the table below. These parameters establish the monthly absolute and relative minimum and maximum thresholds. A value of zero effectively turns off the limit.
| Input variable within MetaTrader | Default value | Comment |
|---|---|---|
| > (ISP) Performance month abs min (0.0 -> OFF) | 0.0 | If the account equity is at $10,000 and the minimum value is set at -100, trading will be suspended if the equity falls below $9,900. Trading will resume at the beginning of the next month, with the equity at that moment used as the new reference point. The input value cannot be greater than 0. |
| > (ISP) Performance month abs max (0.0 -> OFF) | 0.0 | If the account equity is at $10,000 and the minimum value is set at 100, trading will be suspended if the equity rises above $10,100. Trading will resume at the beginning of the next month, with the equity at that moment used as the new reference point. The input value cannot be smaller than 0. |
| > (ISP) Performance month rel min (0.0 -> OFF) | 0.0 | If the account equity is at $10,000 and the minimum value is set at -0.15, trading will be suspended if the equity falls below $9,850. The value will be reset and trading will be reactivated at the start of the next month. The equity at the beginning of the next period serves as a new reference value to calculate the performance limits. The input value cannot be greater than 0. |
| > (ISP) Performance month rel max (0.0 -> OFF) | 0.0 | If the account equity is at $10,000 and the minimum value is set at 0.15, trading will be suspended if the equity rises above $10,150. The value will be reset and trading will be reactivated at the start of the next month. The equity at the beginning of the next period serves as a new reference value to calculate the performance limits. The input value cannot be smaller than 0. |
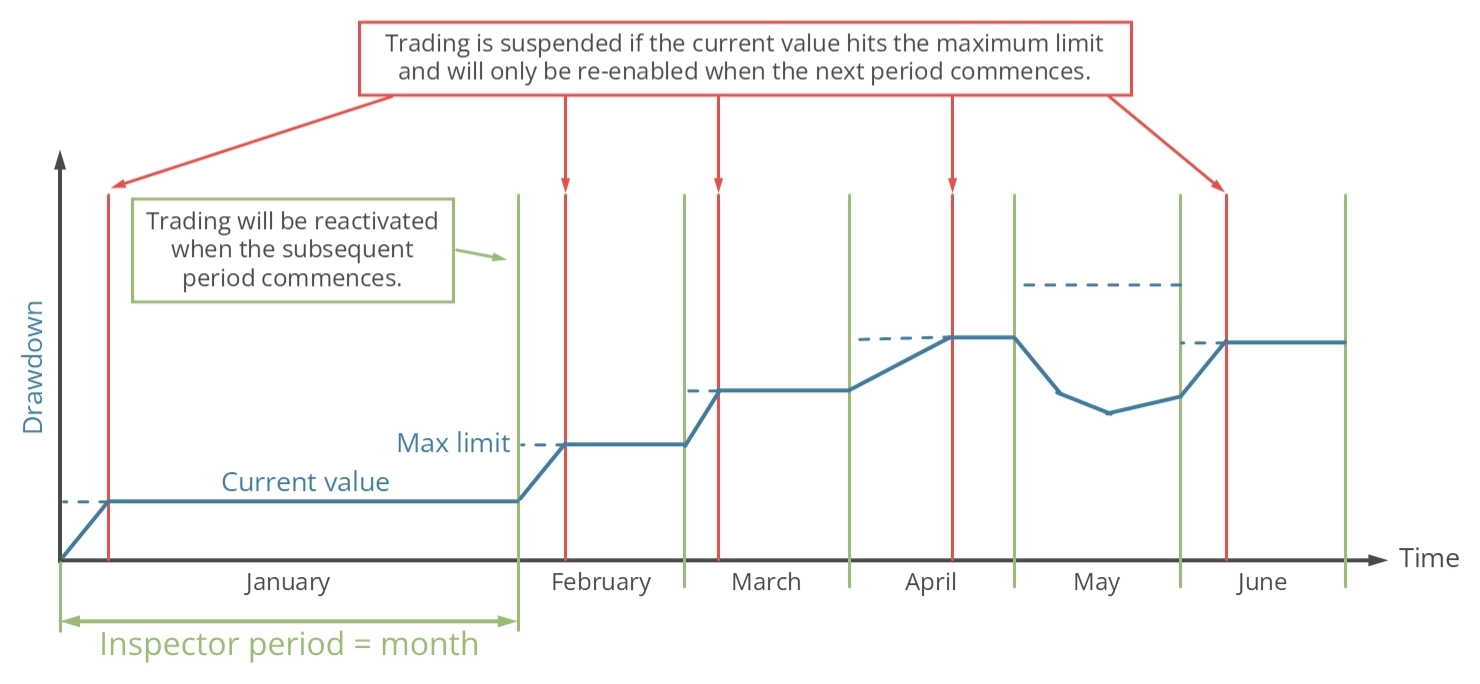
Separate input parameters exist for the maximum and minimum permissible performance results. This allows the application to suspend the initiation of new trades when positive or negative performance results are achieved. The diagram below elucidates the operational principle of monthly inspector protection.
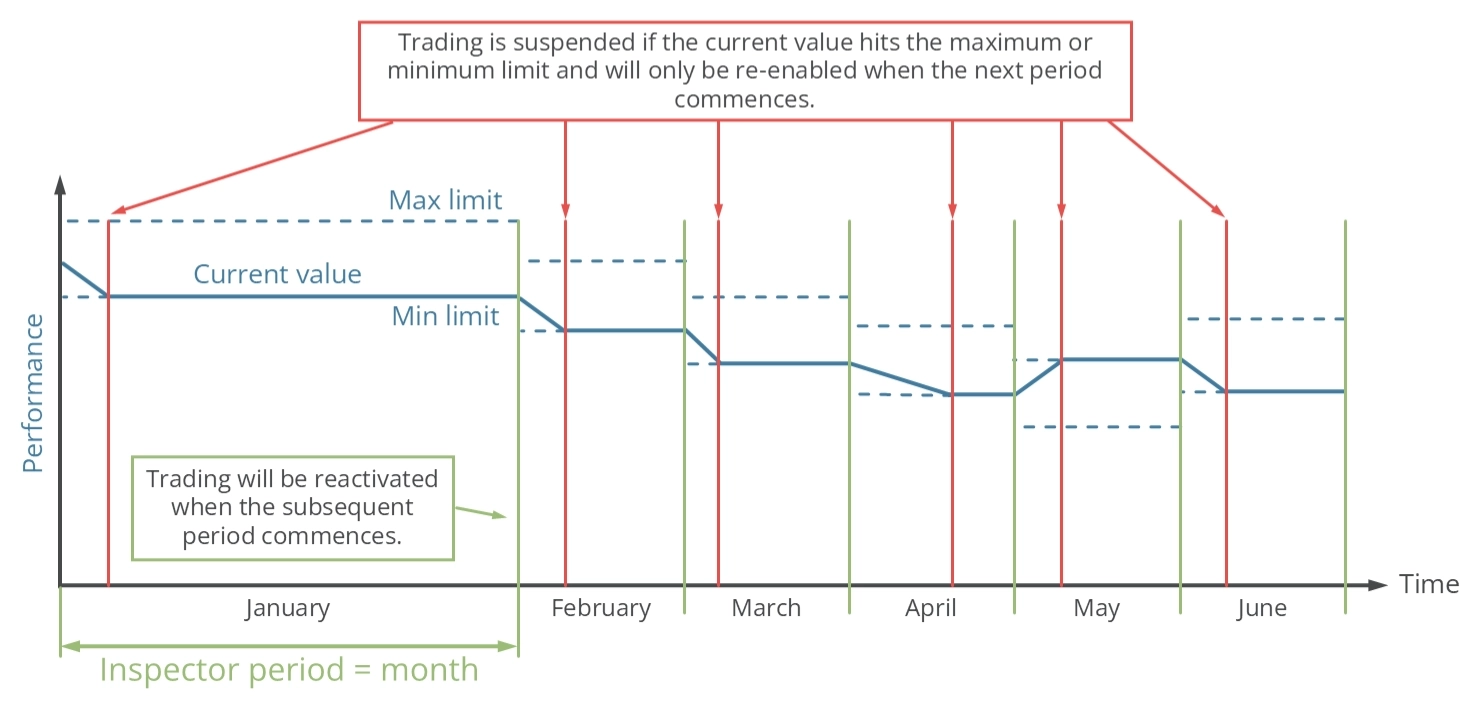
The inspection period is set to one month. If the performance reaches the maximum or minimum value within this period, the ability to open new trades will be temporarily suspended. At the start of a new period, which in this case is the 1st day of the month, the performance value for the month is reset, and trading is resumed. This cycle continues indefinitely.
Performance - Yearly protection
The inspector engine can be configured to halt trading once a specified yearly performance limit is reached using the input parameters outlined in the table below. These parameters establish the yearly absolute and relative minimum and maximum thresholds. A value of zero effectively turns off the limit.
| Input variable within MetaTrader | Default value | Comment |
|---|---|---|
| > (ISP) Performance year abs min (0.0 -> OFF) | 0.0 | If the account equity is at $10,000 and the minimum value is set at -100, trading will be suspended if the equity falls below $9,900. Trading will resume at the beginning of the next year, with the equity at that moment used as the new reference point. The input value cannot be greater than 0. |
| > (ISP) Performance year abs max (0.0 -> OFF) | 0.0 | If the account equity is at $10,000 and the minimum value is set at 100, trading will be suspended if the equity rises above $10,100. Trading will resume at the beginning of the next year, with the equity at that moment used as the new reference point. The input value cannot be smaller than 0. |
| > (ISP) Performance year rel min (0.0 -> OFF) | 0.0 | If the account equity is at $10,000 and the minimum value is set at -0.15, trading will be suspended if the equity falls below $9,850. The value will be reset and trading will be reactivated at the start of the next year. The equity at the beginning of the next period serves as a new reference value to calculate the performance limits. The input value cannot be greater than 0. |
| > (ISP) Performance year rel max (0.0 -> OFF) | 0.0 | If the account equity is at $10,000 and the minimum value is set at 0.15, trading will be suspended if the equity rises above $10,150. The value will be reset and trading will be reactivated at the start of the next year. The equity at the beginning of the next period serves as a new reference value to calculate the performance limits. The input value cannot be smaller than 0. |
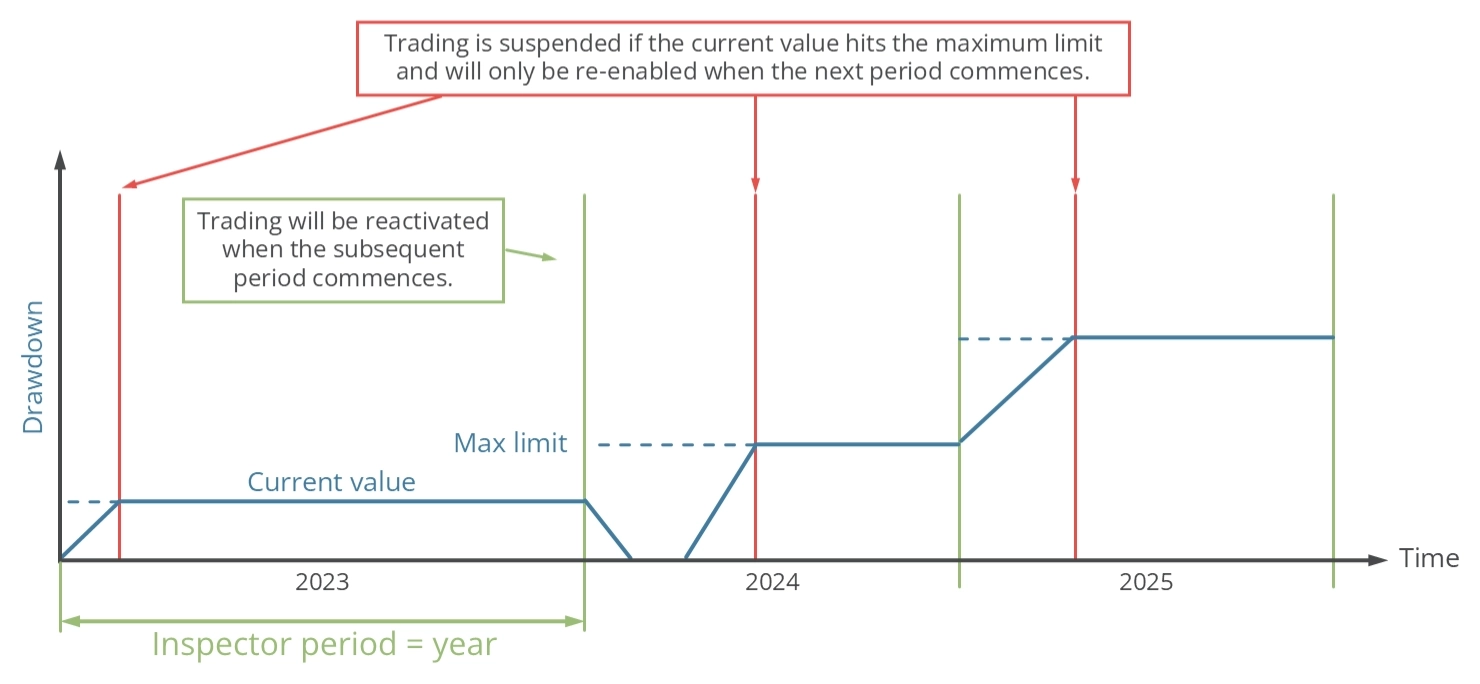
Separate input parameters exist for the maximum and minimum permissible performance results. This allows the application to suspend the initiation of new trades when positive or negative performance results are achieved. The diagram below elucidates the operational principle of the yearly inspector protection.
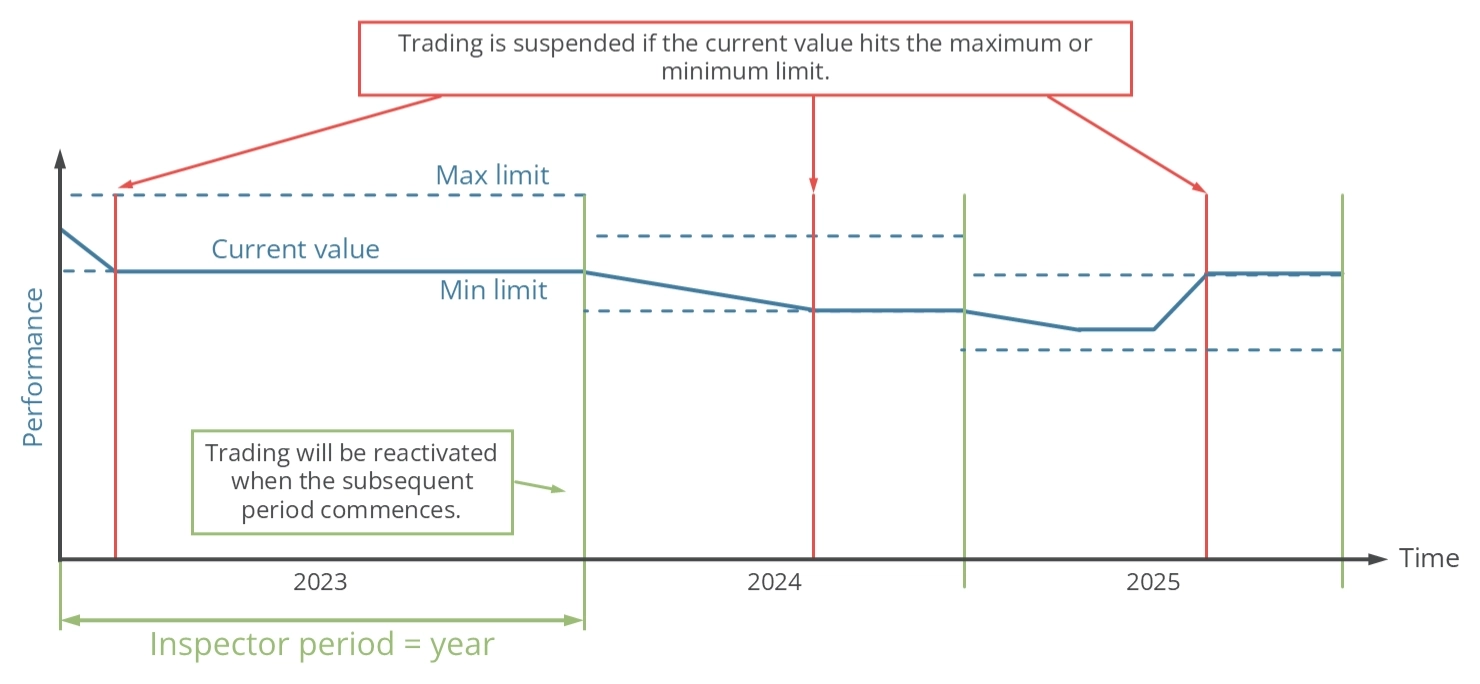
The inspection period is set to one year. If the performance reaches the maximum or minimum value within this period, the ability to open new trades will be temporarily suspended. At the start of a new period, which in this case is on the 1st of January, the performance value for the year is reset, and trading resumes. This cycle continues indefinitely.
Performance - Since start protection
The inspector engine can be configured to halt trading once a specified performance limit is reached using the input parameters outlined in the table below. These parameters establish the absolute and relative minimum and maximum thresholds. A value of zero effectively turns off the limit.
| Input variable within MetaTrader | Default value | Comment |
|---|---|---|
| > (ISP) Performance since start abs min (0.0 -> OFF) | 0.0 | If the account equity is at $10,000 and the minimum value is set at -100, trading will be suspended if the equity falls below $9,900. The input value cannot be greater than 0. |
| > (ISP) Performance since start abs max (0.0 -> OFF) | 0.0 | If the account equity is at $10,000 and the minimum value is set at 100, trading will be suspended if the equity rises above $10,100. The input value cannot be smaller than 0. |
| > (ISP) Performance since start rel min (0.0 -> OFF) | 0.0 | If the account equity is at $10,000 and the minimum value is set at -0.15, trading will be suspended if the equity falls below $9,850. The input value cannot be greater than 0. |
| > (ISP) Performance since start rel max (0.0 -> OFF) | 0.0 | If the account equity is at $10,000 and the minimum value is set at 0.15, trading will be suspended if the equity rises above $10,150. The input value cannot be smaller than 0. |
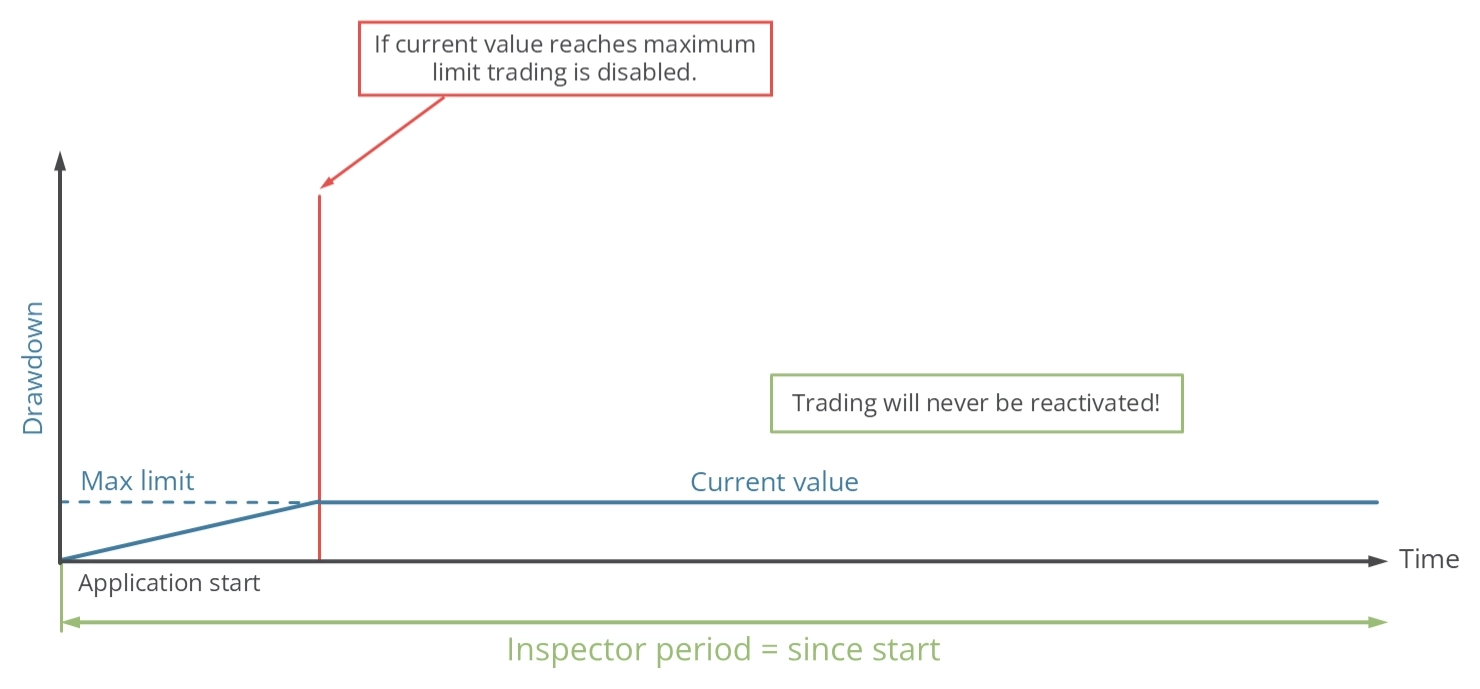
Separate input parameters exist for the maximum and minimum permissible performance results. This allows the application to suspend the initiation of new trades when positive or negative performance results are achieved. The diagram below elucidates the operational principle of inspector protection.
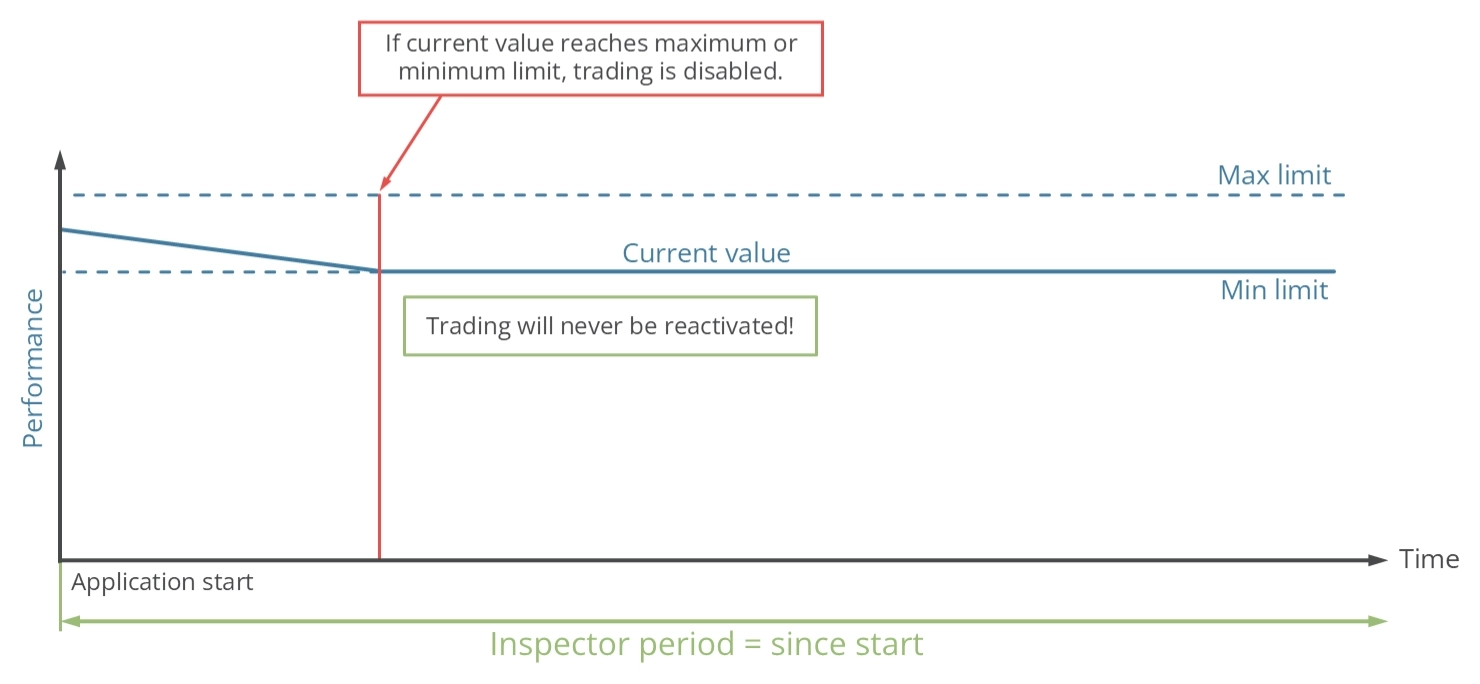
The inspection period begins when the application is started. If the performance reaches the maximum or minimum value, the ability to open new trades will be permanently suspended.
Drawdown - Daily protection
The inspector engine can be configured to halt trading once a specified daily drawdown limit is reached using the input parameters outlined in the table below. These parameters establish the daily absolute and relative maximum thresholds. A value of zero effectively turns off the limit.
| Input variable within MetaTrader | Default value | Comment |
|---|---|---|
| > (ISP) Drawdown day abs max (0.0 -> OFF) | 0.0 | If the account equity is set at $10,000 and the maximum value is set at 100, trading will be halted if the drawdown exceeds $100 within a day. Trading will resume at the beginning of the next day, with the equity at that moment used as the new reference point. The input value cannot be smaller than 0. |
| > (ISP) Drawdown day rel max (0.0 -> OFF) | 0.0 | If the account equity is set at $10,000 and the maximum value is set at 0.15, trading will be halted if the drawdown exceeds $150 within a day. Trading will resume at the beginning of the next day, with the starting equity as the reference point. The new reference value is used to calculate the next drawdown limits. The input value cannot be smaller than 0. |
Input parameters exist for the maximum permissible drawdown results. This allows the application to suspend the initiation of new trades when bad performance values are surpassed. The diagram below elucidates the operational principle of daily inspector protection.
The inspection period is set to one day. If the drawdown reaches the maximum value within this period, the ability to open new trades will be temporarily suspended. At the start of a new period, which is at midnight, the drawdown value for the day is reset, and trading is resumed. This cycle continues indefinitely.
Drawdown - Weekly protection
The inspector engine can be configured to halt trading once a specified weekly drawdown limit is reached using the input parameters outlined in the table below. These parameters establish the weekly absolute and relative maximum thresholds. A value of zero effectively turns off the limit.
| Input variable within MetaTrader | Default value | Comment |
|---|---|---|
| > (ISP) Drawdown week abs max (0.0 -> OFF) | 0.0 | If the account equity is set at $10,000 and the maximum value is set at 100, trading will be halted if the drawdown exceeds $100 within a week. Trading will resume at the beginning of the next week, with the equity at that moment used as the new reference point. The input value cannot be smaller than 0. |
| > (ISP) Drawdown week rel max (0.0 -> OFF) | 0.0 | If the account equity is set at $10,000 and the maximum value is set at 0.15, trading will be halted if the drawdown exceeds $150 within a week. Trading will resume at the beginning of the next week, with the starting equity as the reference point. The new reference value is used to calculate the next drawdown limits. The input value cannot be smaller than 0. |
Input parameters exist for the maximum permissible drawdown results. This allows the application to suspend the initiation of new trades when bad performance values are surpassed. The diagram below elucidates the operational principle of daily inspector protection.
The inspection period is set to one week. If the drawdown reaches the maximum value within this period, the ability to open new trades will be temporarily suspended. At the start of a new period, which in this case is midnight between Saturday and Sunday, the drawdown value for the day is reset, and trading is resumed. This cycle continues indefinitely.
Drawdown - Monthly protection
The inspector engine can be configured to halt trading once a specified monthly drawdown limit is reached using the input parameters outlined in the table below. These parameters establish the monthly absolute and relative maximum thresholds. A value of zero effectively turns off the limit.
| Input variable within MetaTrader | Default value | Comment |
|---|---|---|
| > (ISP) Drawdown month abs max (0.0 -> OFF) | 0.0 | If the account equity is set at $10,000 and the maximum value is set at 100, trading will be halted if the drawdown exceeds $100 within a month. Trading will resume at the beginning of the next month, with the equity at that moment used as the new reference point. The input value cannot be smaller than 0. |
| > (ISP) Drawdown month rel max (0.0 -> OFF) | 0.0 | If the account equity is set at $10,000 and the maximum value is set at 0.15, trading will be halted if the drawdown exceeds $150 within a month. Trading will resume at the beginning of the next month, with the starting equity as the reference point. The new reference value is used to calculate the next drawdown limits. The input value cannot be smaller than 0. |
Input parameters exist for the maximum permissible drawdown results. This allows the application to suspend the initiation of new trades when bad performance values are surpassed. The diagram below elucidates the operational principle of daily inspector protection.
The inspection period is set to one month. If the drawdown reaches the maximum value within this period, the ability to open new trades will be temporarily suspended. At the start of a new period, which is the 1st day of the month, the drawdown value for the day is reset, and trading is resumed. This cycle continues indefinitely.
Drawdown - Yearly protection
The inspector engine can be configured to halt trading once a specified yearly drawdown limit is reached using the input parameters outlined in the table below. These parameters establish the yearly absolute and relative maximum thresholds. A value of zero effectively turns off the limit.
| Input variable within MetaTrader | Default value | Comment |
|---|---|---|
| > (ISP) Drawdown year abs max (0.0 -> OFF) | 0.0 | If the account equity is set at $10,000 and the maximum value is set at 100, trading will be halted if the drawdown exceeds $100 within a year. Trading will resume at the beginning of the next year, with the equity at that moment used as the new reference point. The input value cannot be smaller than 0. |
| > (ISP) Drawdown year rel max (0.0 -> OFF) | 0.0 | If the account equity is set at $10,000 and the maximum value is set at 0.15, trading will be halted if the drawdown exceeds $150 within a year. Trading will resume at the beginning of the next year, with the starting equity as the reference point. The new reference value is used to calculate the next drawdown limits. The input value cannot be smaller than 0. |
Input parameters exist for the maximum permissible drawdown results. This allows the application to suspend the initiation of new trades when bad performance values are surpassed. The diagram below elucidates the operational principle of daily inspector protection.
The inspection period is set to one year. If the drawdown reaches the maximum value within this period, the ability to open new trades will be temporarily suspended. At the start of a new period, which is on the 1st of January, the drawdown value for the day is reset, and trading is resumed. This cycle continues indefinitely.
Drawdown - Since start protection
The inspector engine can be configured to halt trading once a specified drawdown limit is reached using the input parameters outlined in the table below. These parameters establish the absolute and relative maximum thresholds. A value of zero effectively turns off the limit.
| Input variable within MetaTrader | Default value | Comment |
|---|---|---|
| > (ISP) Drawdown since start abs max (0.0 -> OFF) | 0.0 | If the account equity is set at $10,000 and the maximum value is set at 100, trading will be halted if the drawdown exceeds $100. The input value cannot be smaller than 0. |
| > (ISP) Drawdown since start rel max (0.0 -> OFF) | 0.0 | If the account equity is set at $10,000 and the maximum value is set at 0.15, trading will be halted if the drawdown exceeds $150. The input value cannot be smaller than 0. |
Input parameters exist for the maximum permissible drawdown results. This allows the application to suspend the initiation of new trades when bad performance values are surpassed. The diagram below elucidates the operational principle of daily inspector protection.
The inspection period begins when the application is started. If the drawdown reaches the maximum value, the ability to open new trades will be permanently suspended.
Limit reached warning
When a predetermined drawdown or performance limit is reached, the Meta Extender will close all open trades and delete any pending orders, irrespective of the current profit status of the trade. As depicted in the image below, a warning will then be displayed.
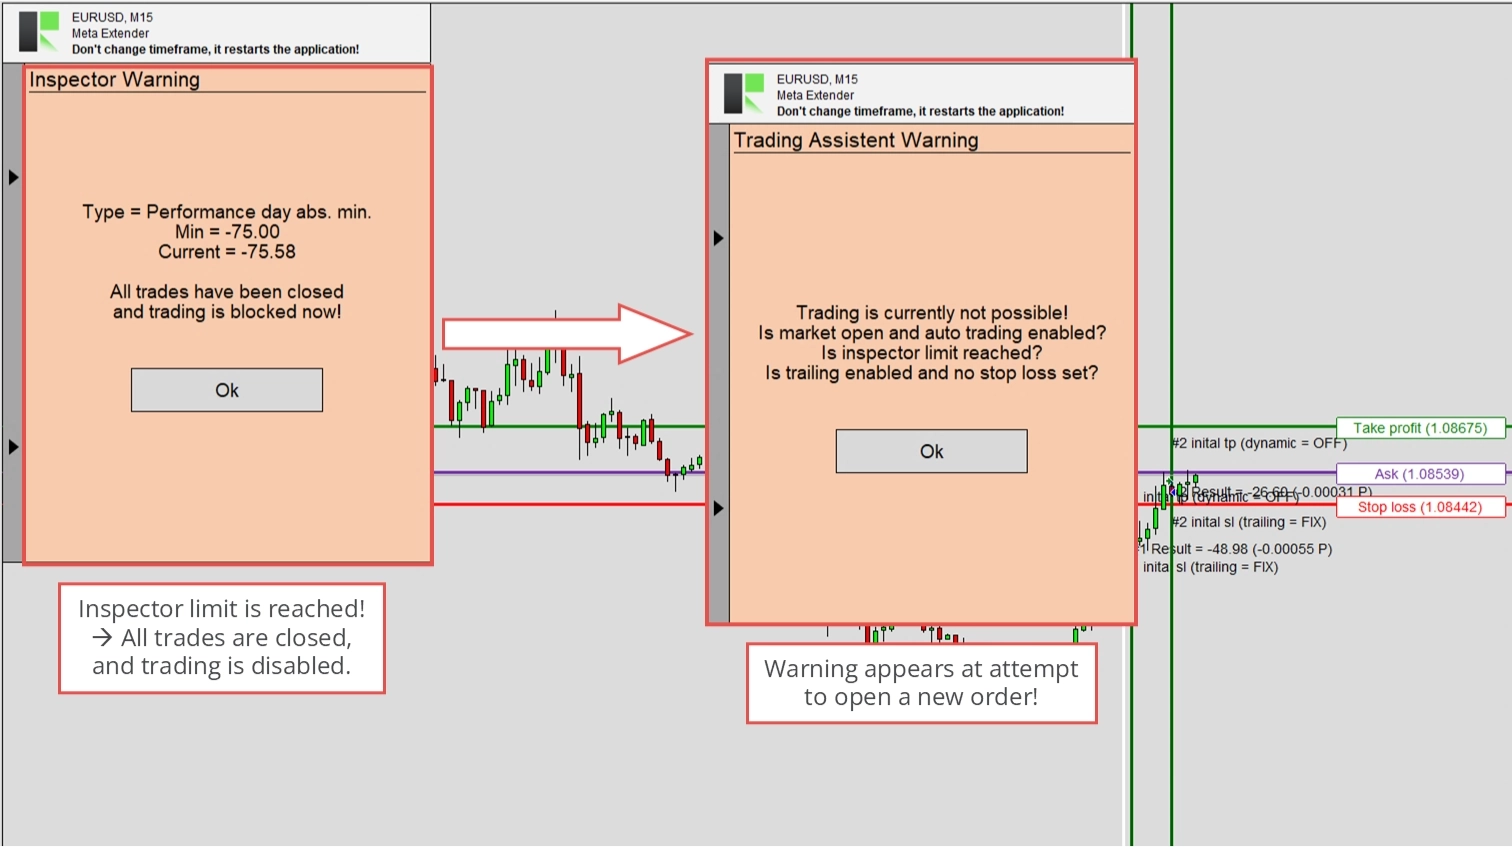
If Meta Extender is selected as the trades to be monitored, the ability to open additional trades using the Trendline Trading or Trading Assistant widget will be disabled. An attempt to do so will trigger a warning message.
If Symbol is selected as the trades to be monitored, the Meta Extender will close all open trades but not restrict the ability to open new trades. However, it may immediately close any newly opened trades.
Suppose MetaTrader is selected as the trade to be monitored. In that case, the Meta Extender will close all open trades and restrict the ability to open new trades by turning off the AutoTrading feature. However, it may immediately close any newly opened trades.
Reviewing your performance or drawdown is highly advisable in a reached inspector limit scenario.
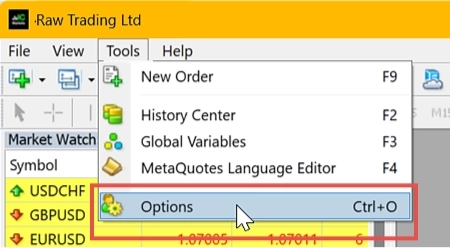
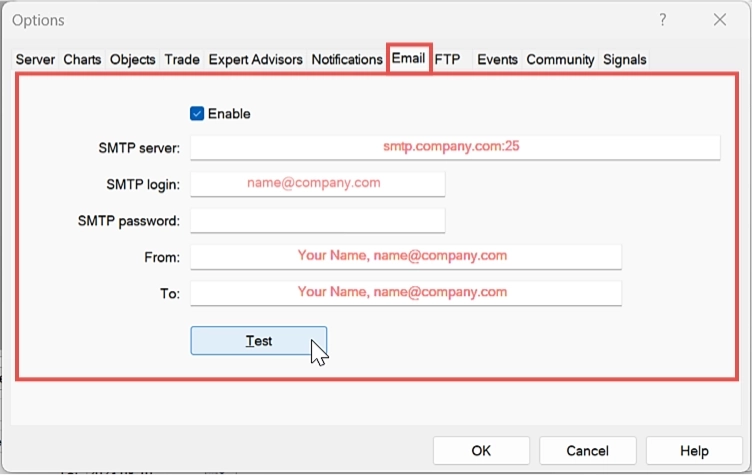
Configuration of notification and email
The Meta Extender can send email and mobile notifications when inspector limits are reached. It utilizes the built-in API of the MetaTrader to transmit this information. However, this requires the configuration of the email and notification settings in your MetaTrader instance. These settings can be found in the Tools - Options menu. Please navigate to this view.
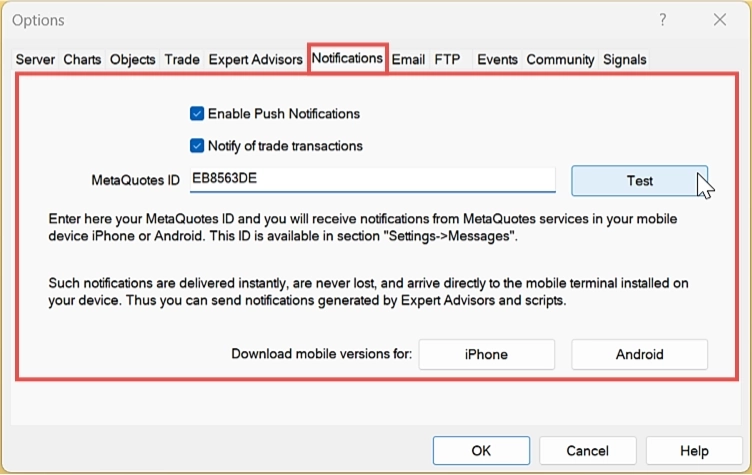
For mobile notifications, you can configure the settings under the Notifications tab.
For email notifications, you can configure the settings under the Email tab.
Widgets
This page provides an overview of all widgets currently available for the Meta Extender. The Meta Extender is designed to be an interactive tool with an intuitive user interface. Since most widgets are self-explanatory, you can quickly familiarize yourself with each widget using a demo account or the strategy tester. However, a brief explanation of each widget is provided below.
Trendline Trading
The Trendline Trading widget allows you to place trendline trading lines on your chart, which can be used to configure your next trade(s). A trade will automatically open whenever the price crosses a so-called trigger line. With further trendlines, you can configure the stop loss and take profit levels. Since the trendlines can be organized in any direction, these lines allow more flexibility due to the dynamic character over time. Many traders analyze charts based on trends, patterns, and support and resistance levels to predict future price movements, often waiting for a signal for hours or days. This process can be conveniently automated by configuring trendlines that are directly used for opening and closing trades. This type of automated trading is considered semi-automatic since a human defines the boundaries, but the Meta Extender performs trades based on these boundaries.
To start using this widget, please open the Trendline Trading widget on the home screen of your Meta Extender.
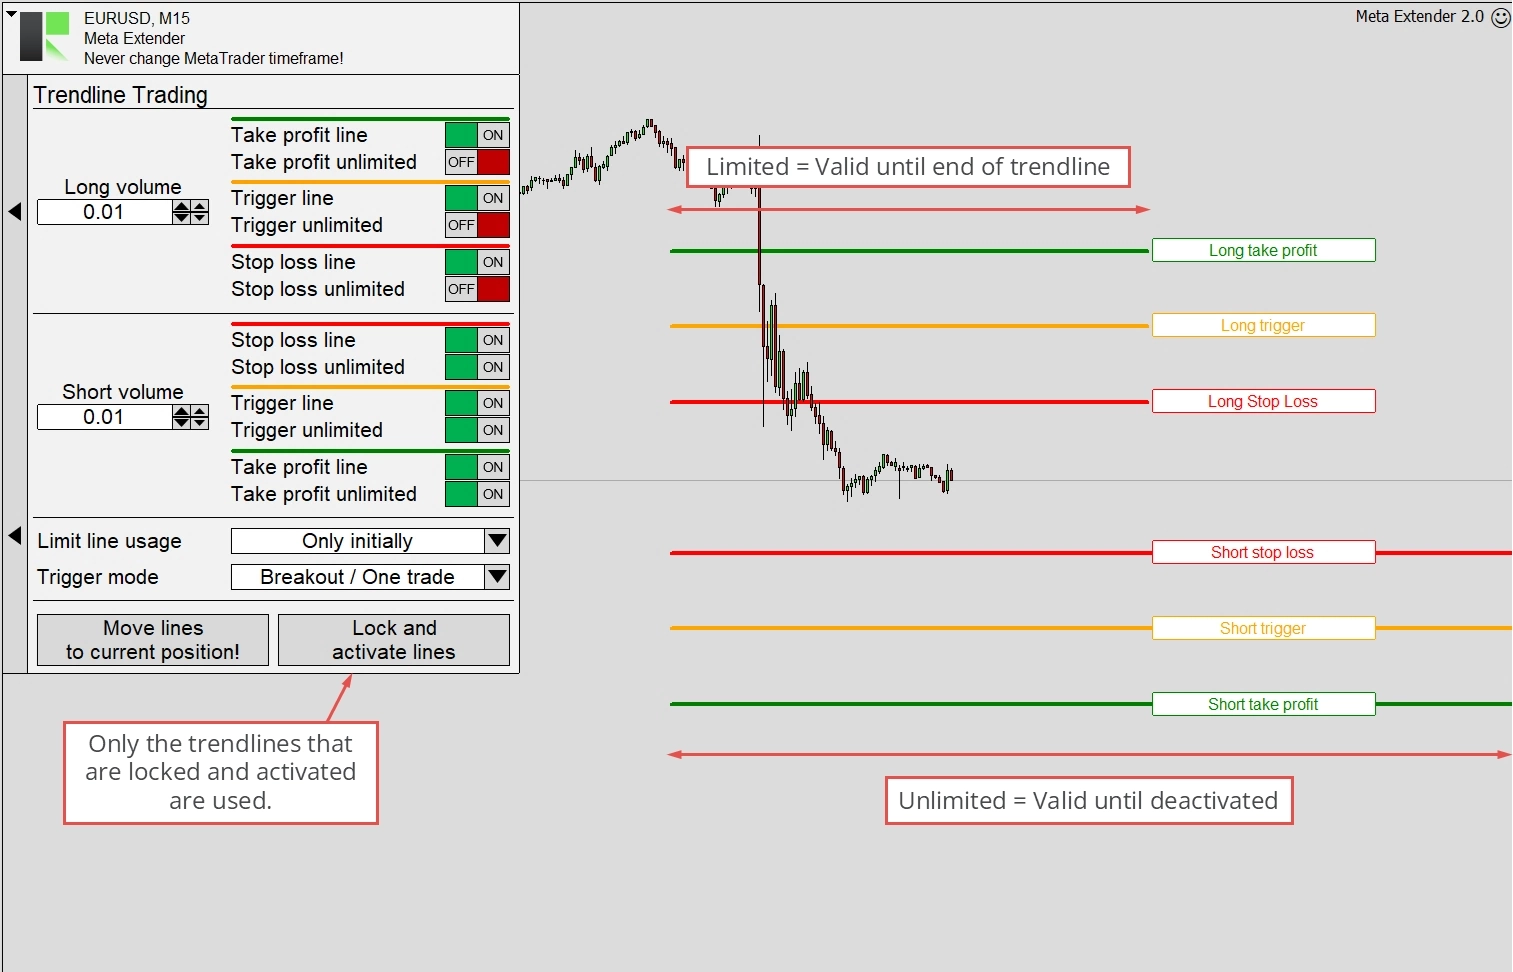
The Trendline Trading widget is divided into two sections: long trading and short trading. Each section has a trigger line, a take profit line, a stop loss line, and a volume size input field. Every trendline can be turned on or off individually, allowing for trades to be opened with or without take profit and stop loss, or in the case of the trigger line, to turn off the feature entirely. However, it’s essential to be aware of the risks of not using a stop loss limit line. Always double-check the volume and your risk and money management preferences!
Each trendline comes with the option to use it in either limited or unlimited mode. The image below shows that the trendline remains valid indefinitely when unlimited mode is enabled. In limited mode, it loses its functionality once the time passes beyond the rightmost point of the trendline. After blending in a trendline, you can drag and drop it freely on the chart and adjust the lines according to your identified pattern. To activate the trendlines, they must be locked. This can be done by pressing the Lock and activate lines button. As the name indicates, the lines are only activated once locked. After the lines are locked, they cannot be moved but can be unlocked anytime.
By clicking on Move lines to current position, the trading lines will be placed in the currently visible area of your chart view.
Upon activation, the logic automatically initiates a trade when the trigger line is crossed, using the volume configured in the panel. Depending on the limit line usage, the widget configures the stop loss and take profit when the trade is opened or uses the lines for dynamically configured take profit and stop loss levels. Two options for how the limit lines can be utilized are illustrated below.
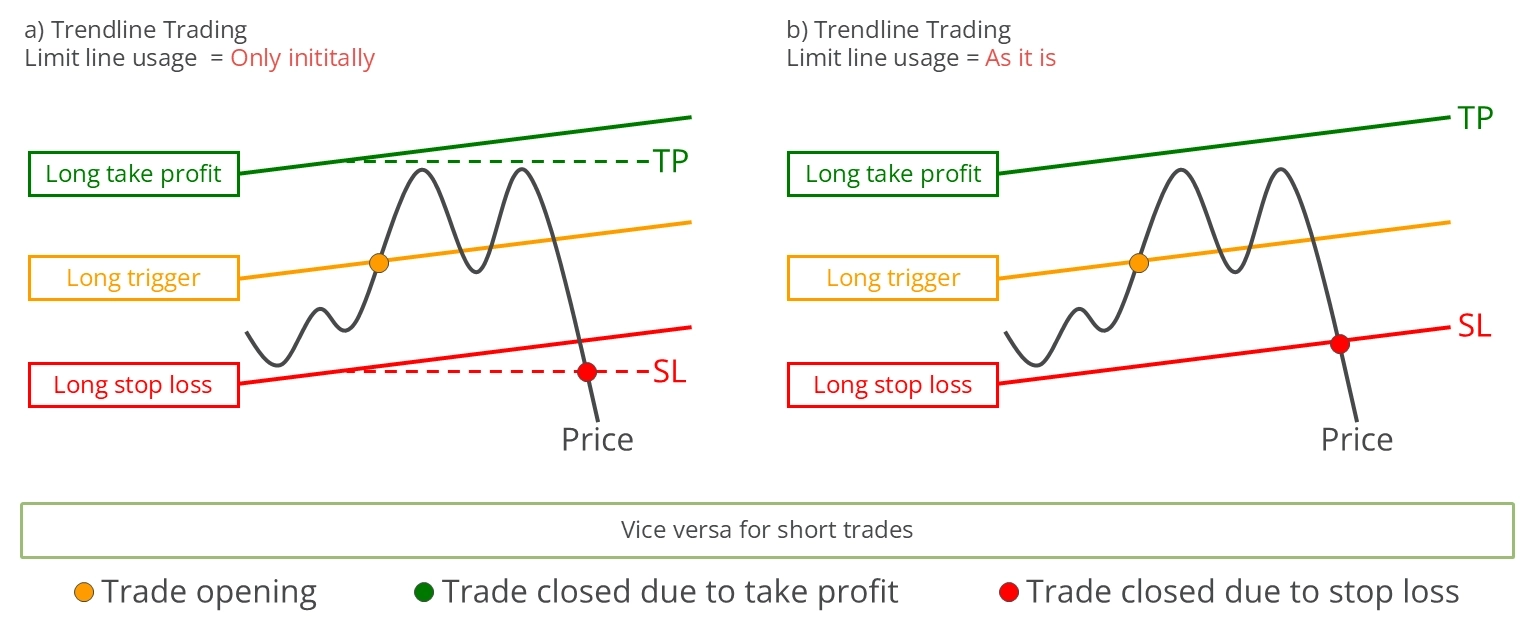
Limit line usage = Only initially
When Only initially is selected as the limit mode, the limit line values at the moment of trade opening are used as the stop loss and take profit values. In this mode, the take profit and stop loss line values are only used once. After a trade is initiated, the trendlines can be unlocked and reused immediately. Thus, the initially configured risk ratio remains static.
Limit line usage = As it is
In contrast, the As it is mode instructs the widget to use the stop loss and take profit trendlines in the same way as the trigger line. The trade is closed whenever the price crosses either the stop loss line or take profit line. This implies a dynamic risk ratio because the stop loss and take profit values are not fixated. With this limit usage method, the dynamic adaptation of the stop loss represents a form of linear stop loss trailing. Unlocking the trendlines while a trade is active will turn off the stop loss functionality. In this case, the widget will issue a warning and inform you to set a stop loss manually.
Next, we’ll discuss the so-called Triggered mode. This setting determines how the trigger lines are used. Two options are available: Breakout and Channel mode, both of which are illustrated below.
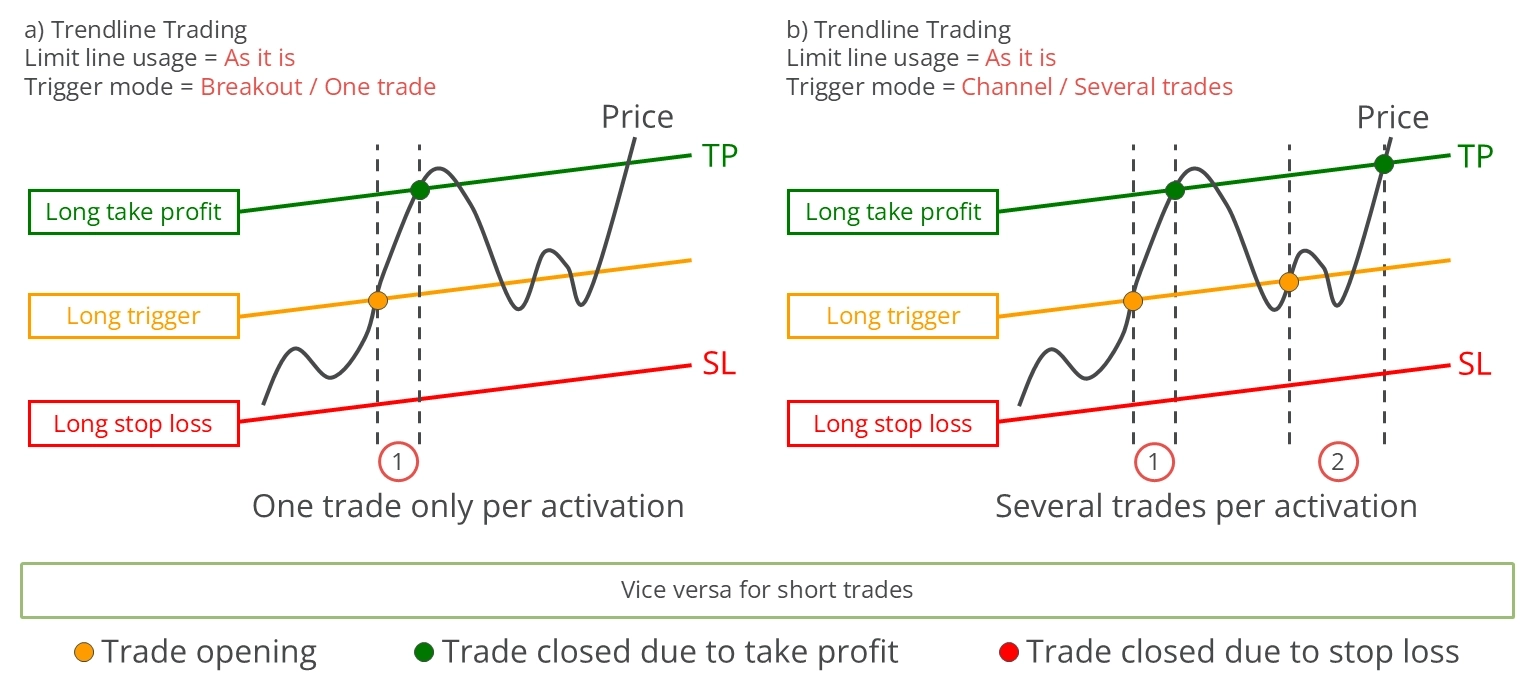
Trigger mode = Breakout / One trade
In Breakout mode, each trigger line can initiate only one trade, regardless of how often the price crosses the trigger line. This mode helps react to expected price movements, such as those that occur after economic news releases. In Breakout mode, a long trade is initiated when the price crosses the long trigger line from below to above, and a short trade is initiated when the price crosses the trigger line from above to below. If the price when locking the trigger line is higher (long direction), no action will be taken until the price drops below the trigger line and then increases again. Conversely, the process is reversed for short positions: if the price when setting the trigger line is lower, no action will be taken until the price rises above the trigger line and decreases again.
Trigger mode = Channel / Several trades
In Channel mode, the trigger line initiates a trade each time the price crosses it from below to above for long trades and from above to below for short trades. The Channel mode is especially beneficial for trading within support and resistance levels or trend channels that exhibit repeated minor downward and upward movements. Unlike the Breakout mode, which allows for only one open trade at a time, the Channel mode permits multiple trades to be open simultaneously.
In both modes, the trendlines can only be locked and activated when the current price is between each trendline’s left and right points. This condition must be met for all trendlines that are used. The stop loss trailing system configured in the Trading Assistant widget and Meta Extender will also apply to trades initiated with the Trendline Trading widget.
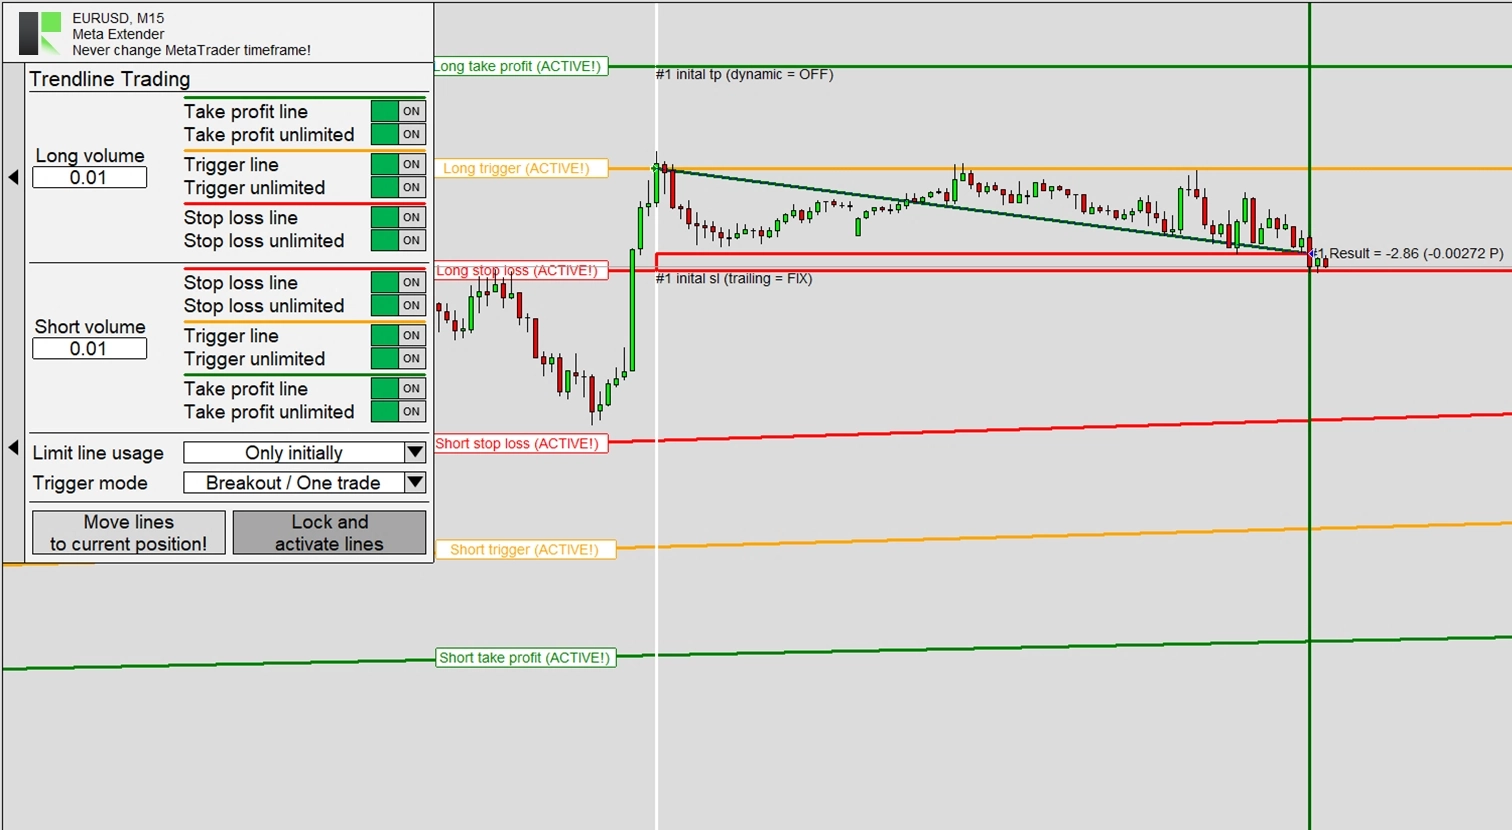
The above chart illustrates the process of initiating a long trade using the Trendline Trading widget. As depicted, the long trade is triggered when the price ascends and intersects the trigger line. The initial stop loss for this trade was set using the value from the stop loss trendline. Shortly after the trade opened, a fixed distance trailing stop was used, but it remained static due to the continuously falling price. The trade was eventually stopped out after a brief period.
Trading Assistant
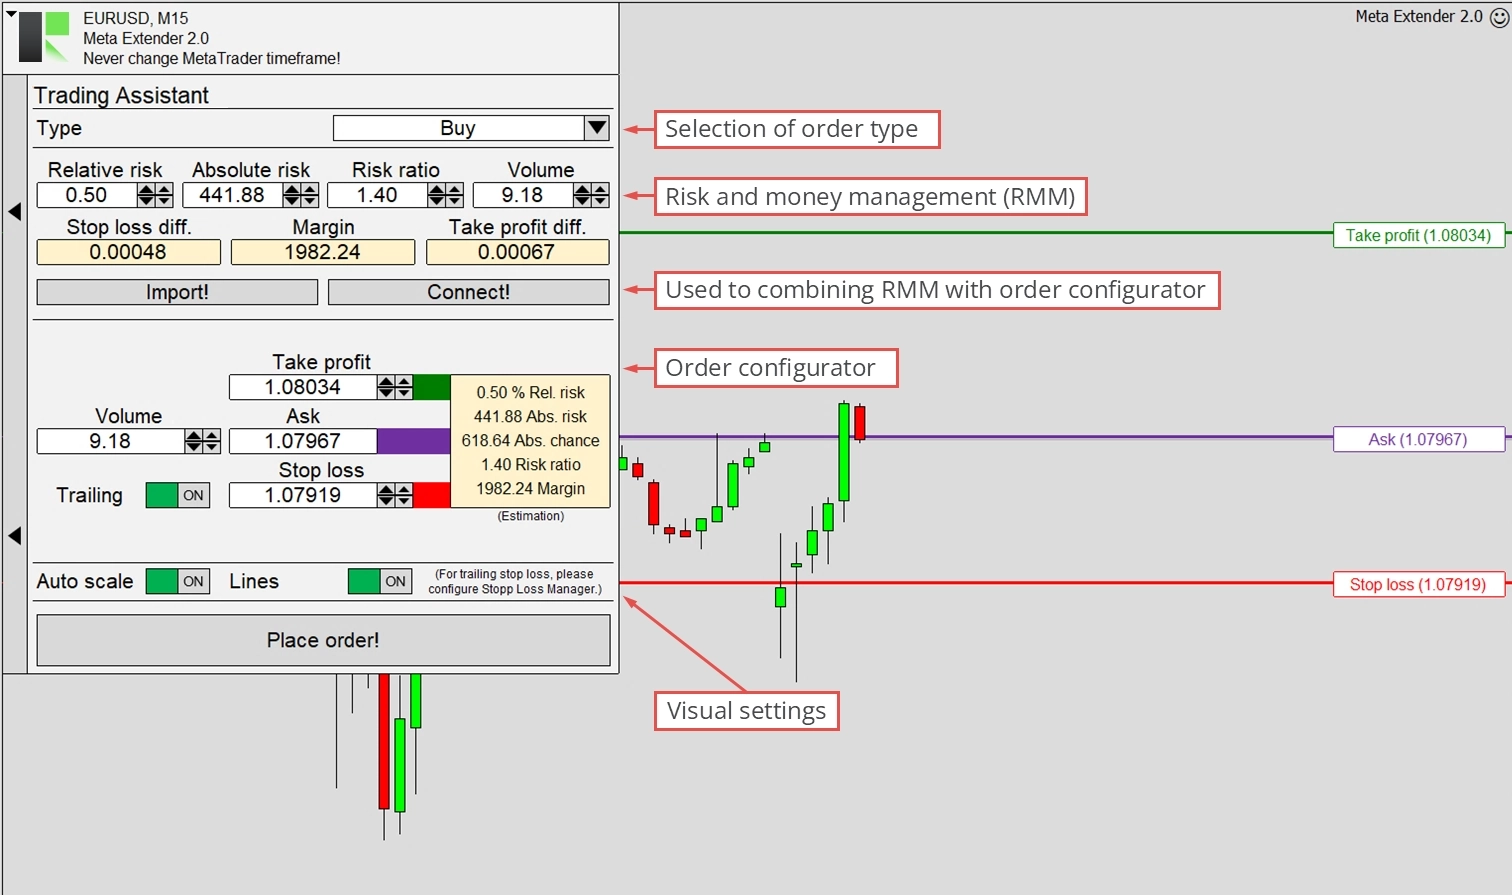
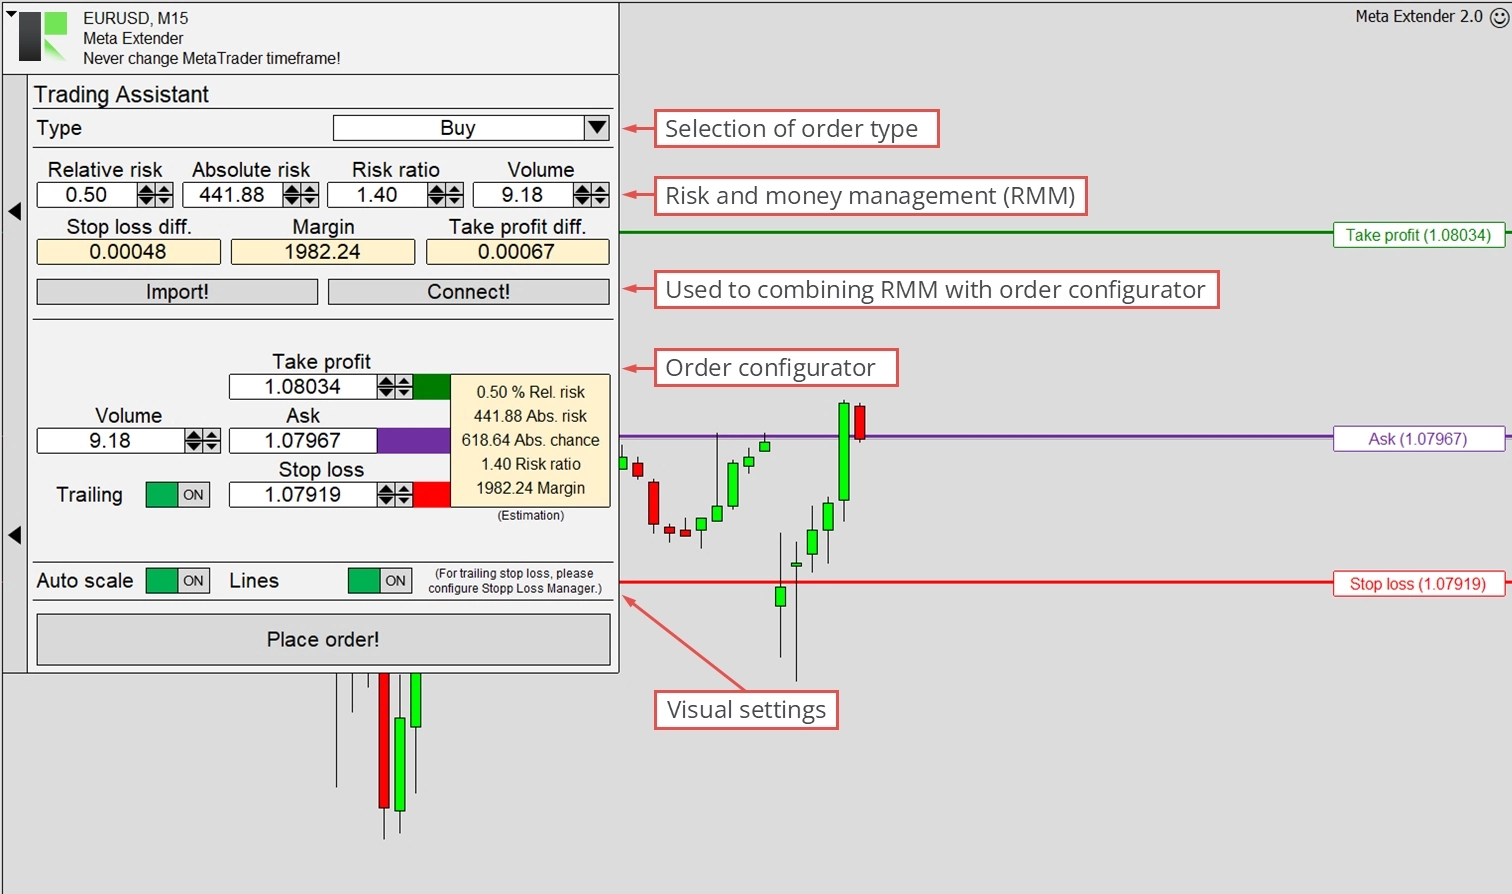
The following widget we’ll discuss is the Trading Assistant. This tool is designed to simplify order placement by using chart lines to configure all order parameters, making risk and money management straightforward and visual. It also offers the option to enable sophisticated stop loss trailing management. You can view the widget by clicking Trading Assistant on your Meta Extender home screen.
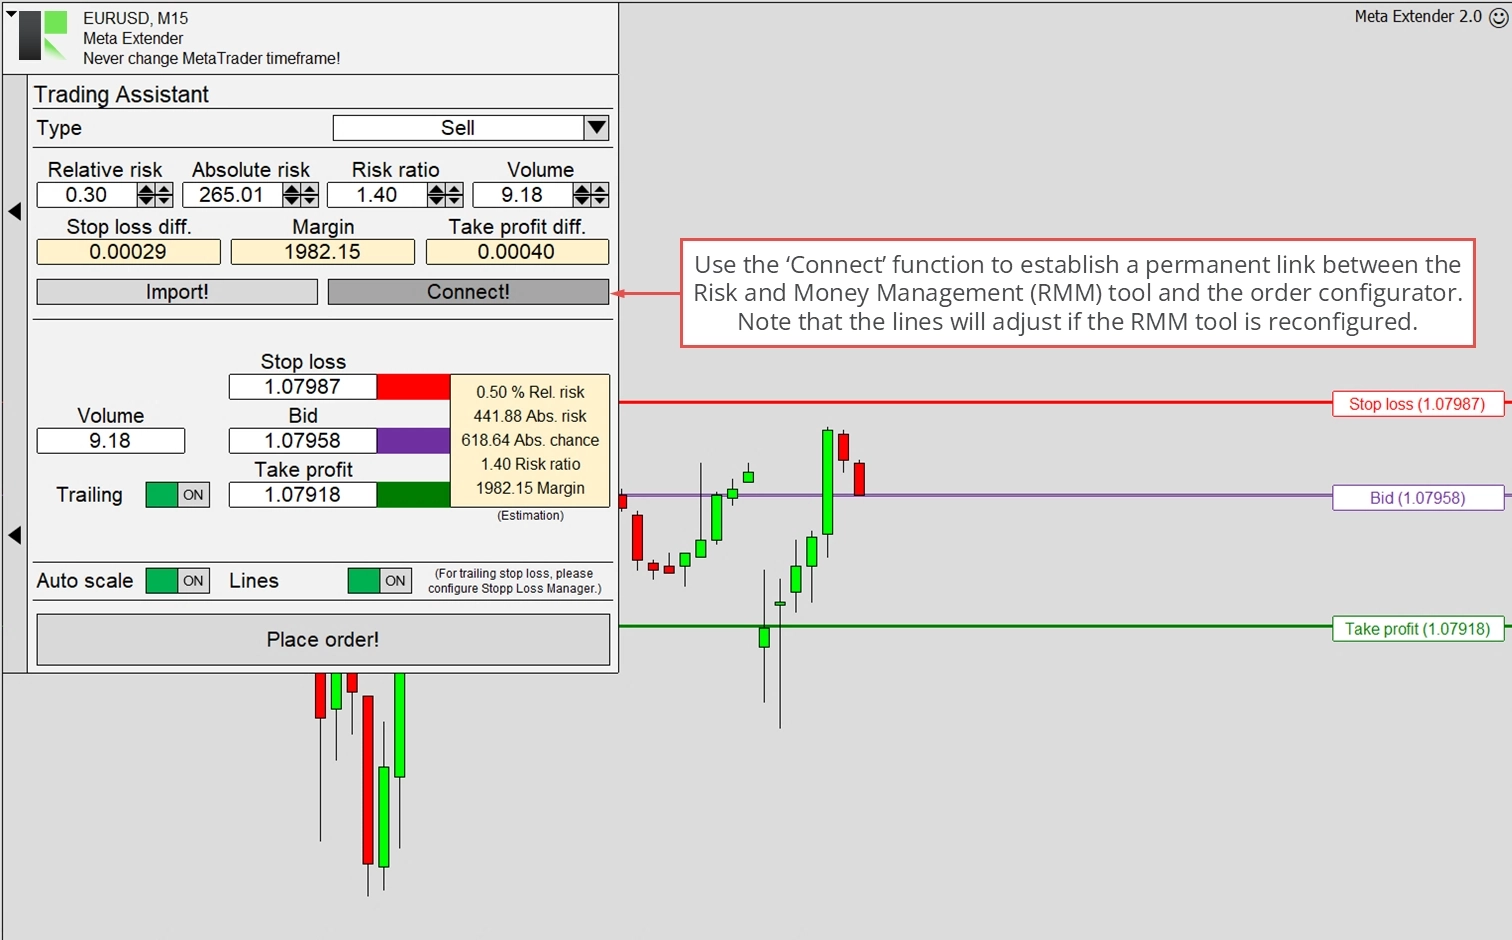
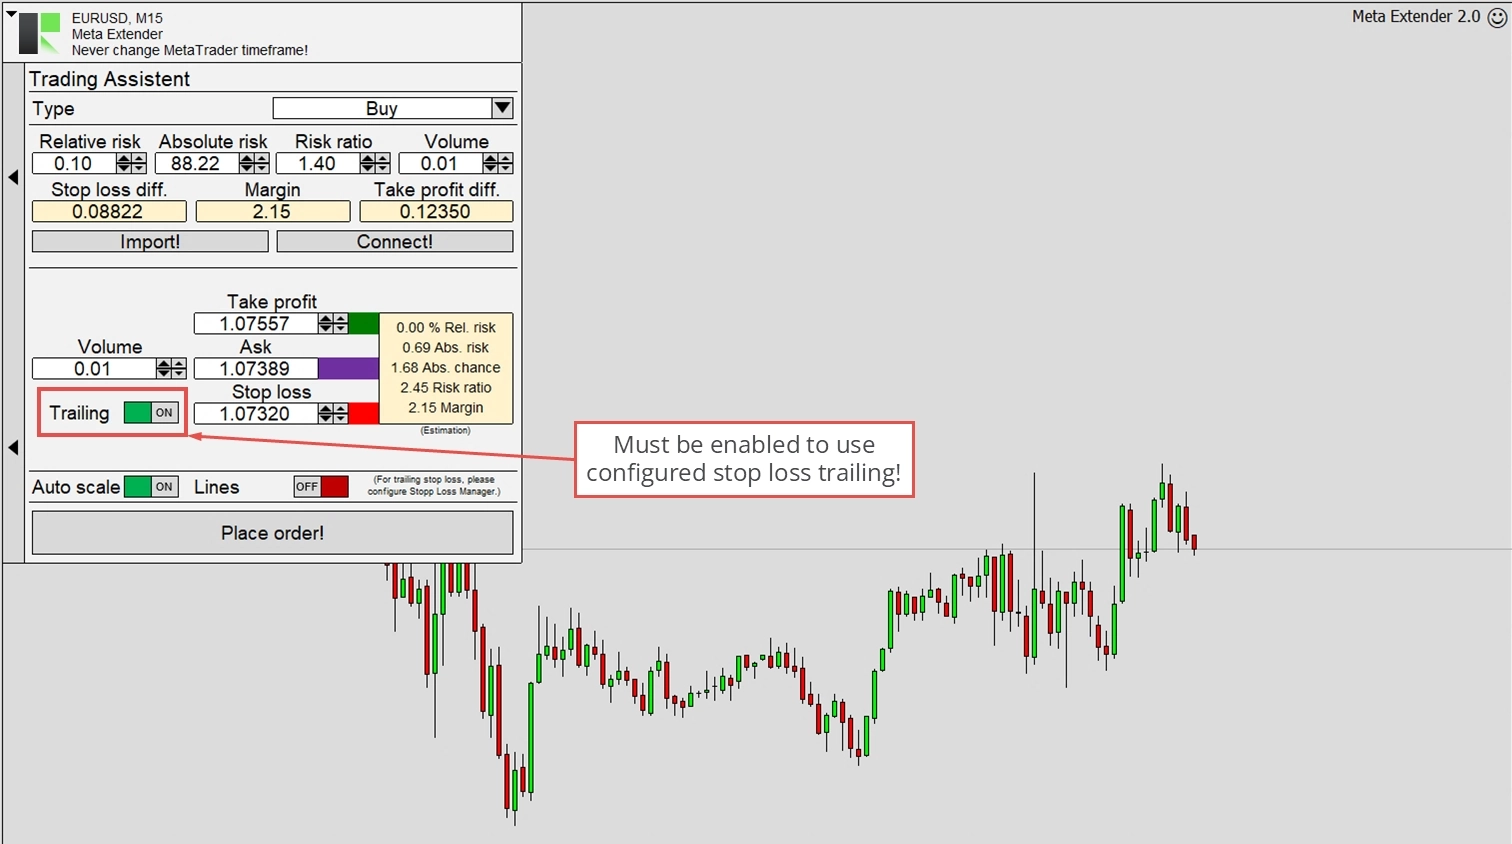
The Trading Assistant view comprises two main features: the Risk and Money Management input parameters and the Order Configurator. The former allows you to input the absolute or relative risk and the planned position volume. The tool then provides the stop loss difference, take profit, and required margin. These values are updated in real-time as you modify the input parameters. Please note that this calculation does not include commission and swap, often influencing the risk or potential chance.
The Order Configurator ensures that only valid orders can be transmitted to your broker’s server. For instance, limit and stop orders can be used with a pending price, while market orders cannot. Depending on the order type (the topmost input on the widget), it verifies the correctness of all input parameters. Another key feature is the Trailing switch, which enables stop loss trailing, a strategy to help protect open profit and limit risk when the trade moves in your favor. The actual stop loss configuration can be done with the Meta Extender widget, but the final decision to turn it on or off is made in the Trading Assistant. Once trailing is enabled, this setting is applied globally for all other features, notably the Trendline Trading widget.
At the bottom of the widget screen, you’ll find switches to change MetaTrader’s auto-scaling setting and enable the chart configuration lines. Each input parameter (Take Profit, Pending Price, Stop Loss, and Expiration) can be configured directly in the chart view or with the input fields. By using this handy tool, you can automatically practice trading based on proper risk and money management, with the most crucial calculations automated in the background.
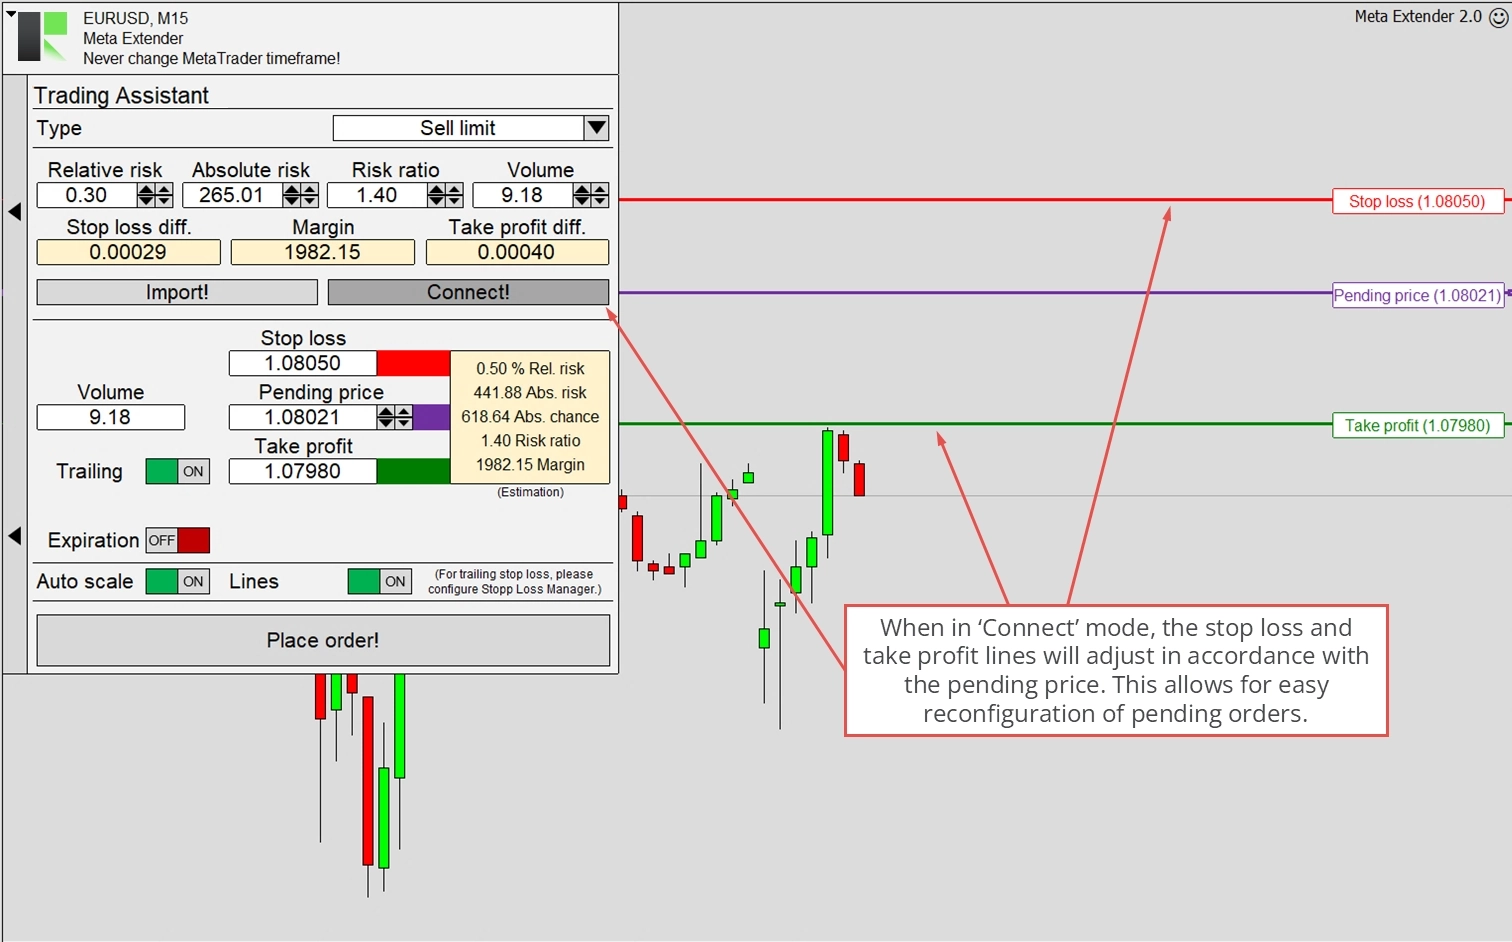
The illustration below demonstrates how the chart view appears when a limit order is selected for configuration. The stop loss and take profit lines are color-coded depending on the trade direction to ensure clear visibility.
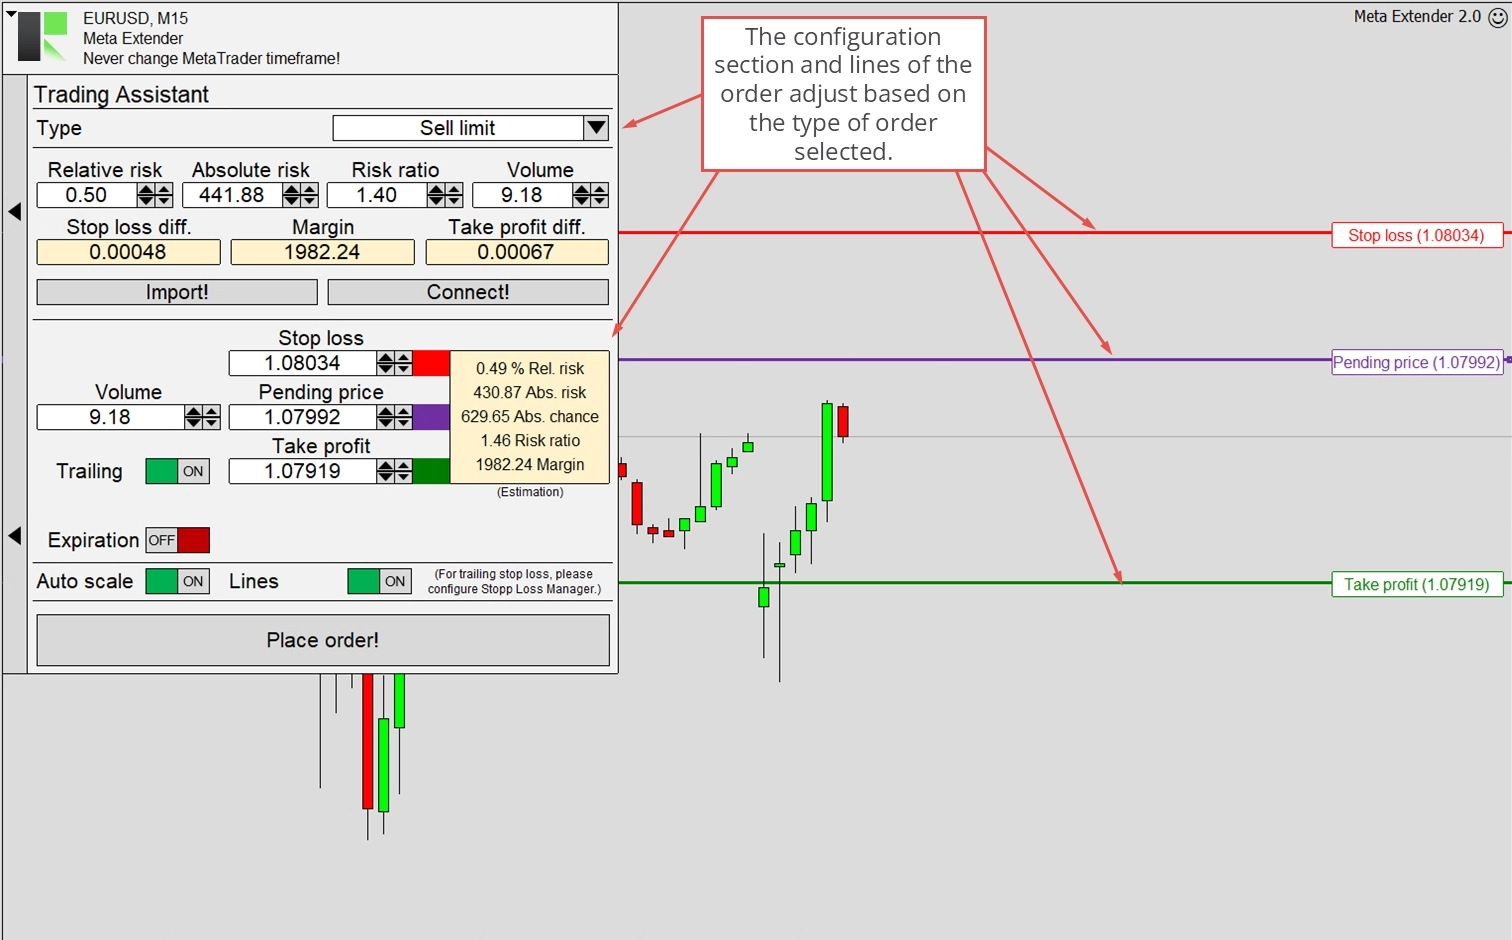
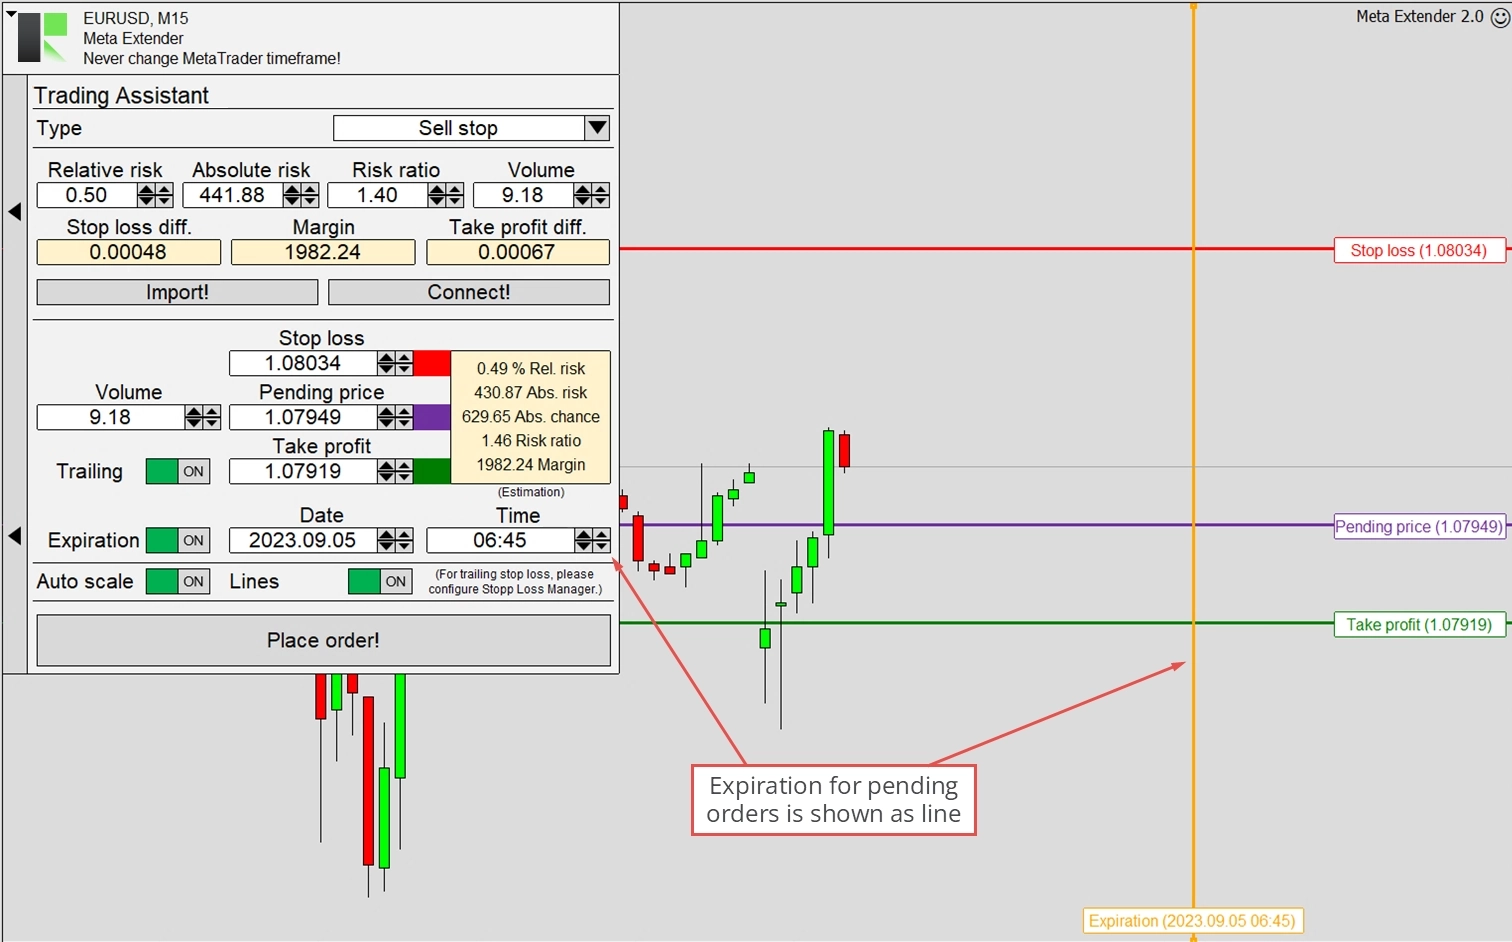
It’s possible to set an expiration date for limit and stop orders. The pending order will be deleted if the pending price isn’t triggered by the expiration date. The expiration date can be configured with a horizontal line or the Date and Time input parameters.
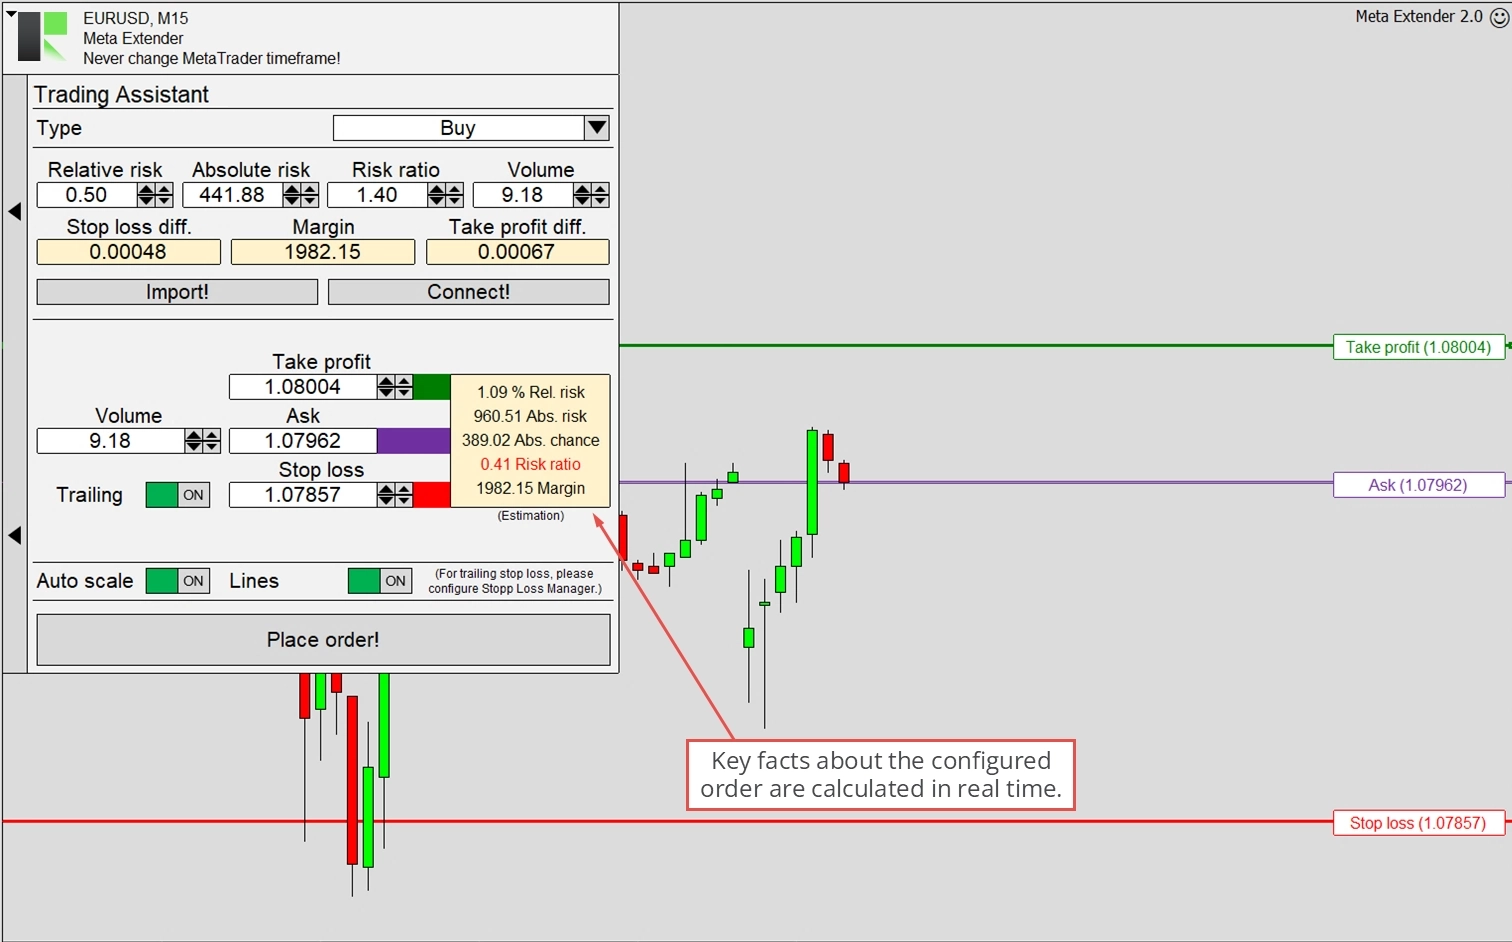
When the input parameters are changed, the yellow outlet box updates the trade key facts like relative risk, absolute risk, and other important information. If specific parameters require your attention, this will also be displayed in this outlet box. For example, when the risk ratio is too low or no stop loss is configured. These input constellations are considered poor risk and money management measures, and the widget will notify you of this.
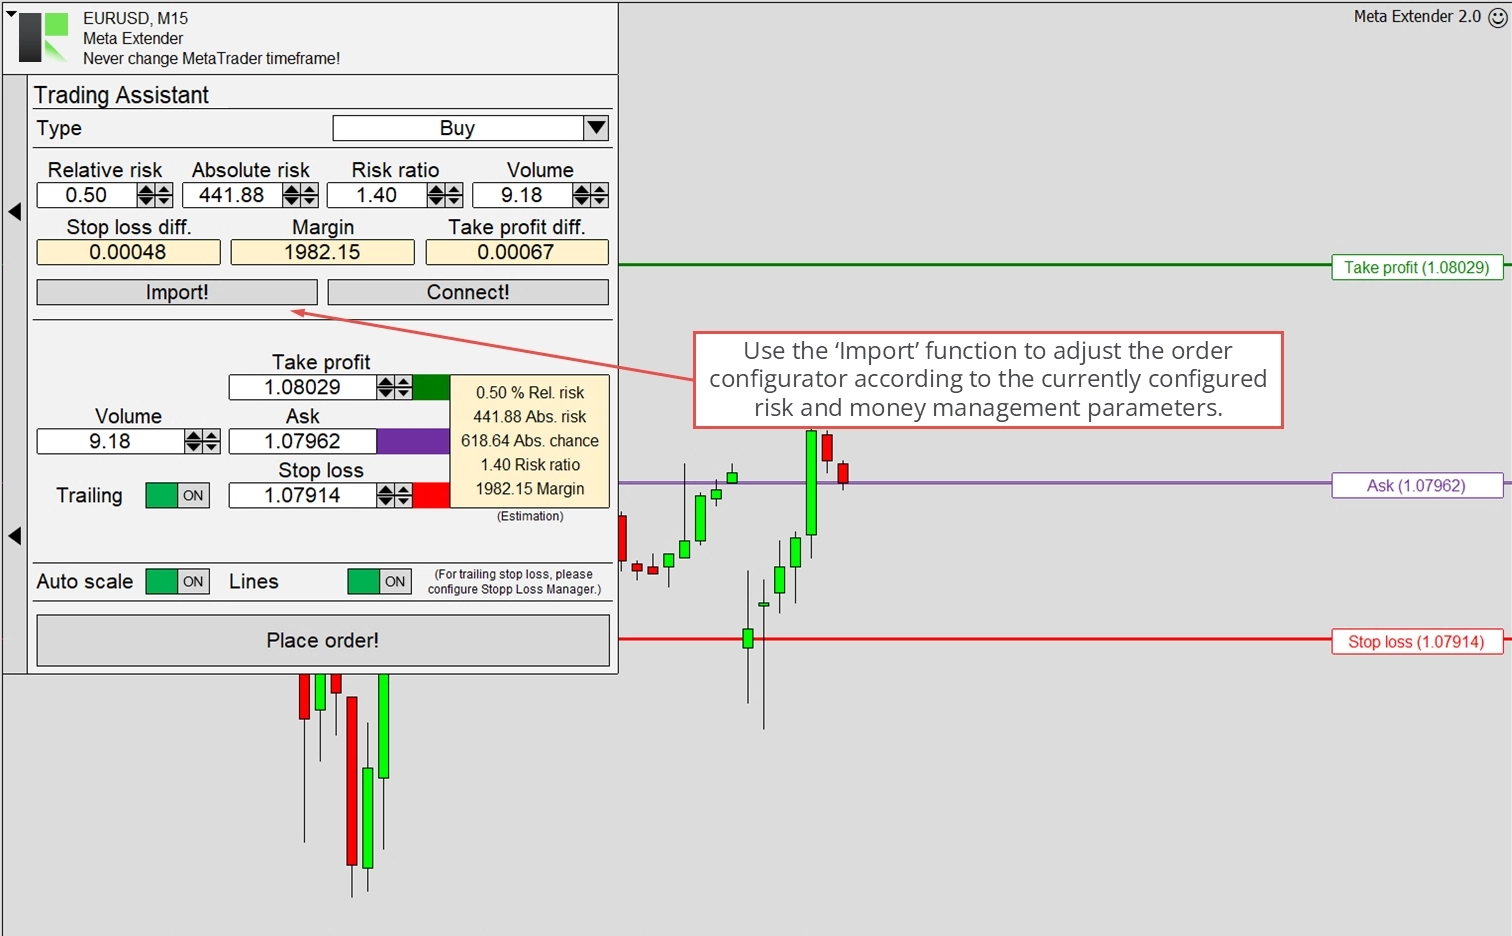
The widget integrates risk and money management, which can interact with the order configurator. You can import the currently configured risk and money management settings by pressing the import button. This action adjusts all input parameters of the order configuration to match your risk preferences. While this is a one-time process, you can still adjust using the input field or trading lines.
Linking both modules is another way to integrate risk and money management with the order configurator. If this option is used, the stop loss, take profit, and volume can no longer be configured with the order configurator. Instead, every trade is exclusively configured by the risk and money management input parameters. This manual trading method is highly recommended for beginners, and even professionals will appreciate the simplicity of configuring orders in this manner.
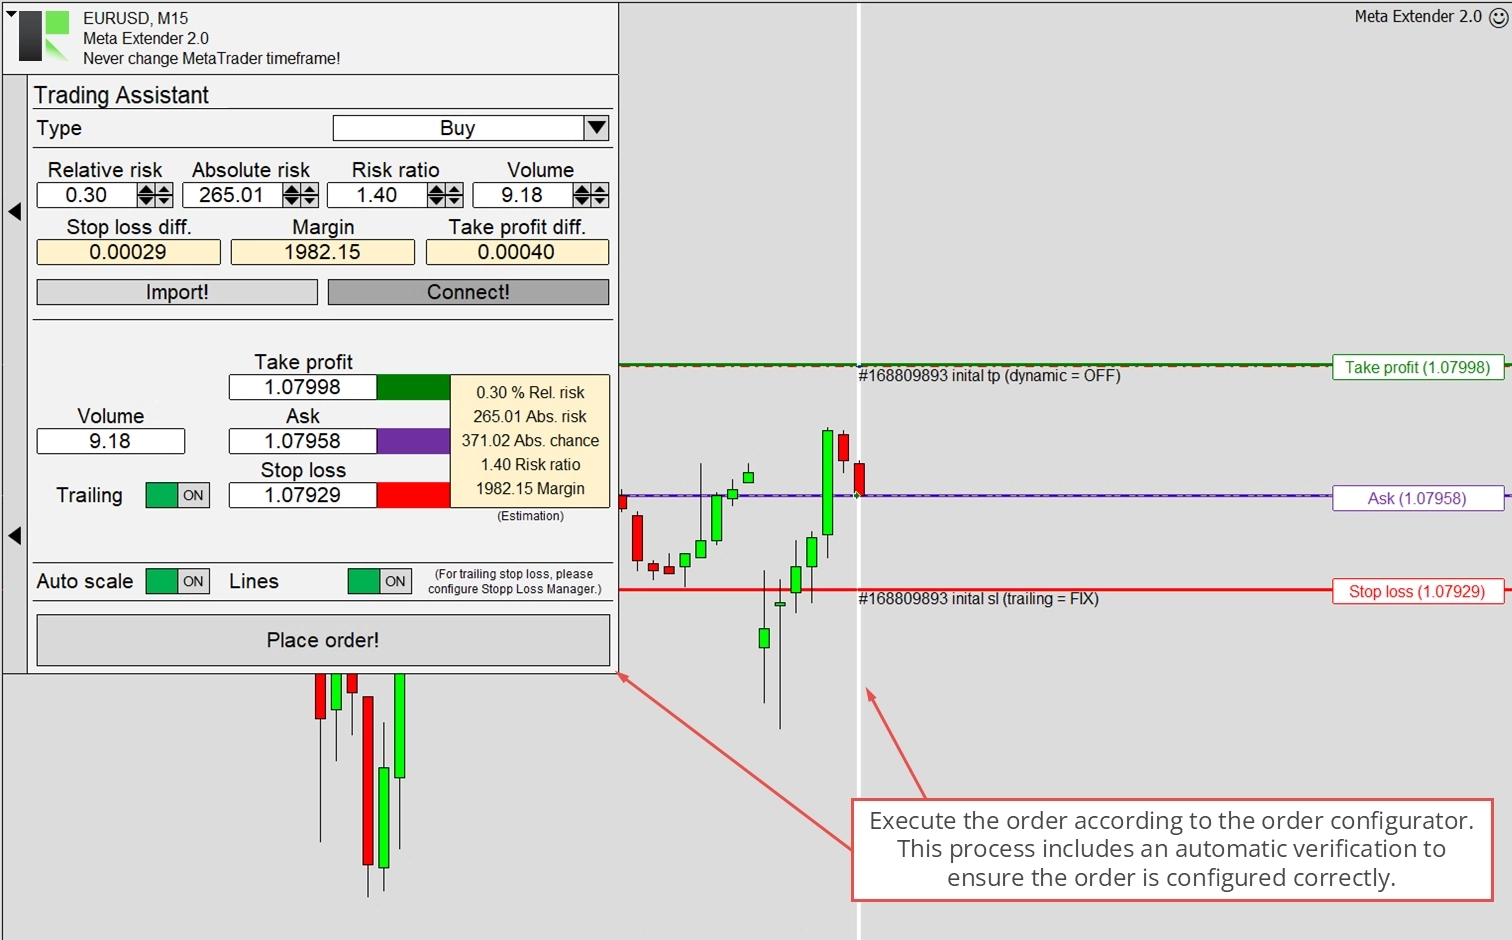
When the connect mode is enabled, the stop loss and take profit lines adjust accordingly when the pending price line is reconfigured. This ensures proper risk and money management settings, even for limit and stop orders. This feature is illustrated in the image below.
After configuring the order, you can place a trade by pressing Place order! Please note that the Meta Extender is designed as a one-click application, meaning there won’t be any approval dialog to confirm your decision to place an order.
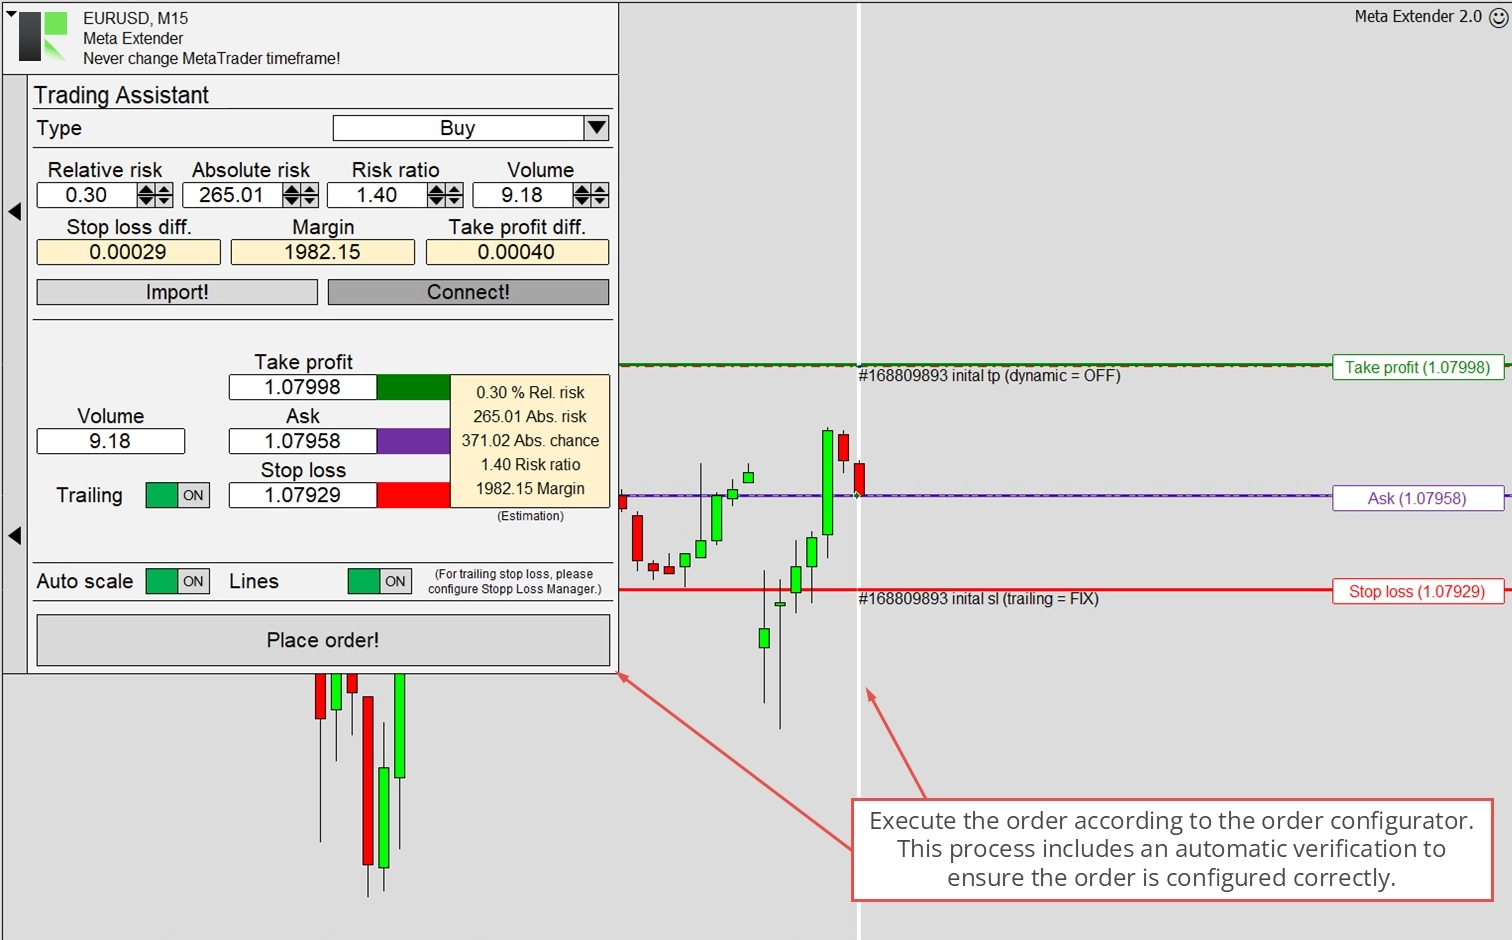
Orders can only be placed when the market is open; consequently, trading is permitted. The widget will display an error if an order cannot be placed. This typically occurs if the market is closed or you attempt to place an order with stop loss trailing but without an initial stop loss.
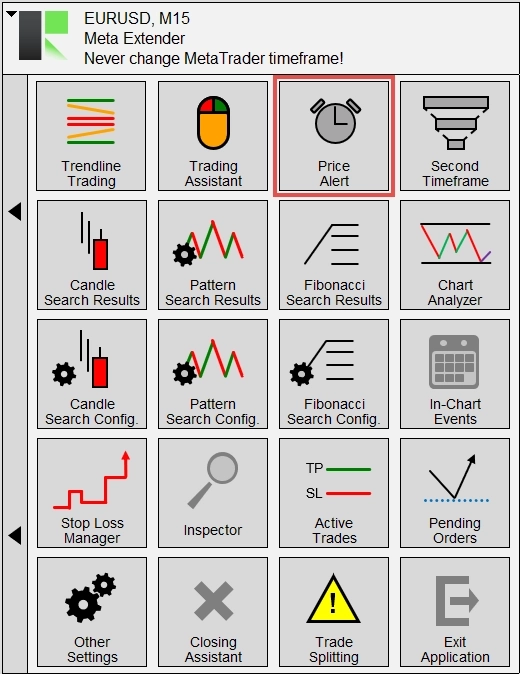
Price Alert
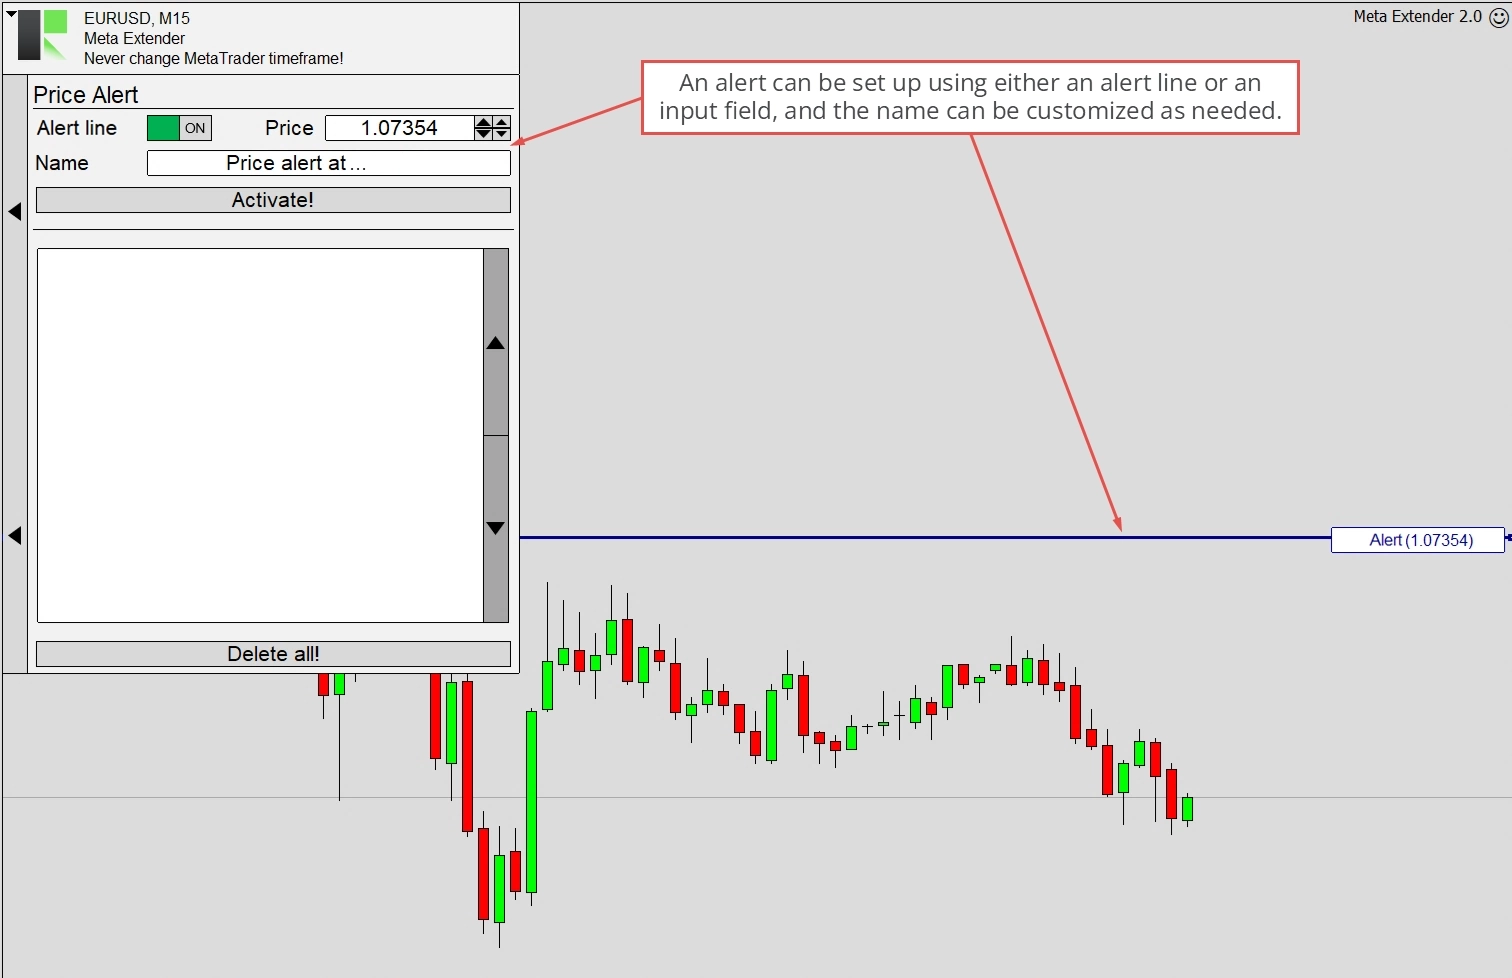
The Price Alert widget is a convenient feature that enables you to receive alerts through email or on your mobile device when a specific price level is achieved. This tool is especially beneficial for tracking price levels such as support and resistance. To access it, choose Price Alert from the Meta Extender home screen.
The widget is straightforward to set up and use. The only parameters you need to set are the price at which the alert should be activated. You can configure it by moving a line directly on the chart or using an input field. Each alert can also be renamed to save some notes.
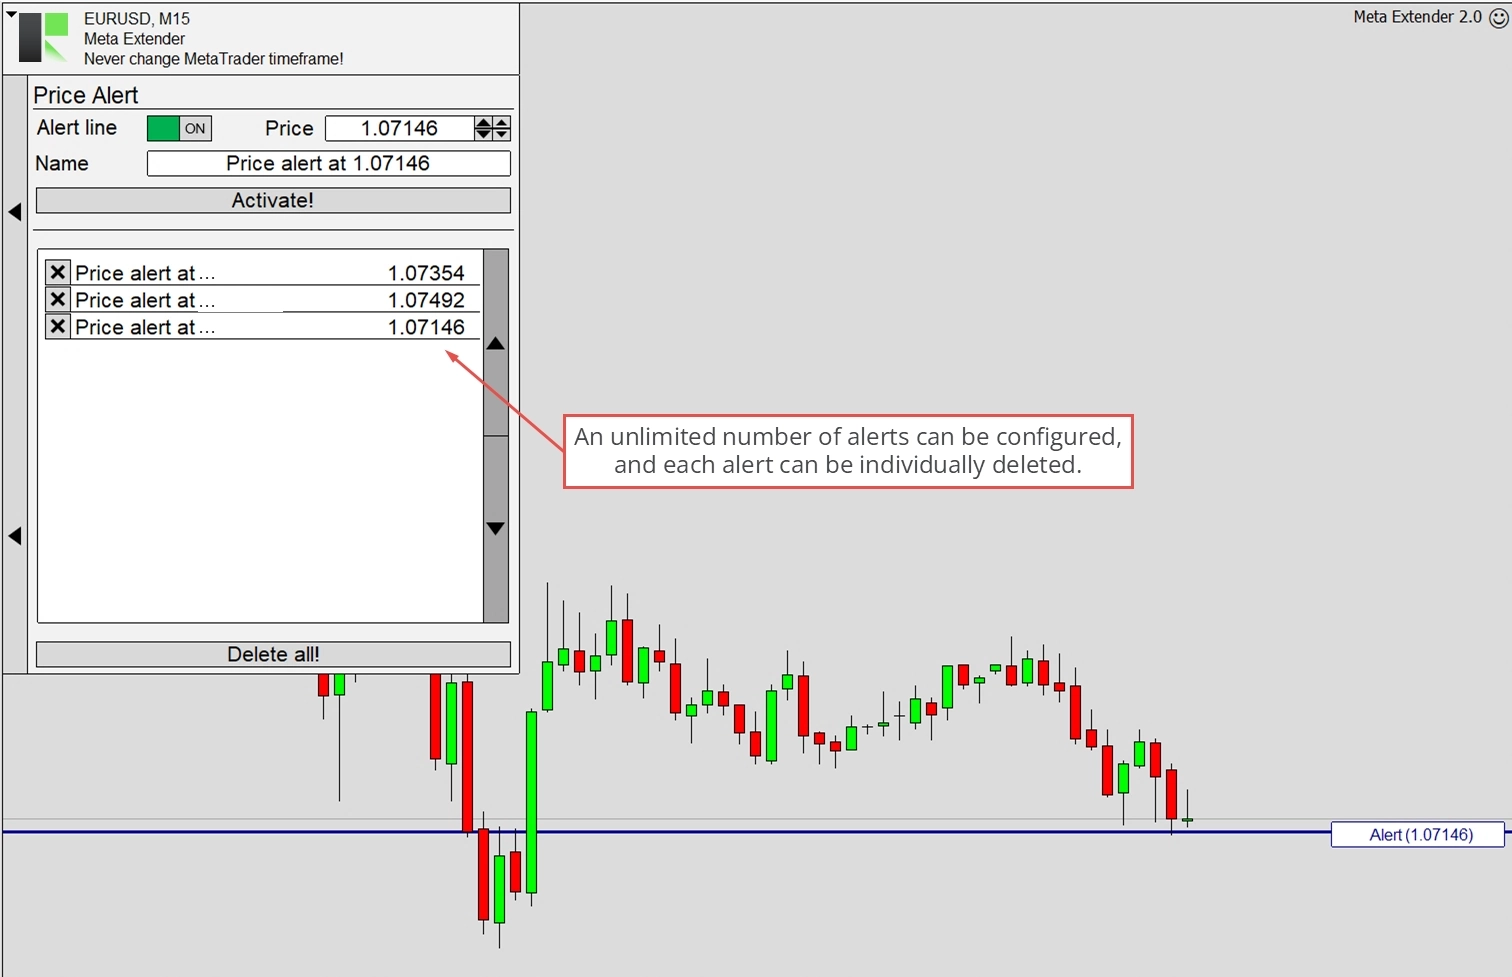
By clicking Activate, you can save and enable an alert. Each alert’s name and trigger value will be displayed in the table area. You can create and activate an unlimited number of alerts.
When an alert’s price is reached, Meta Extender will notify you directly in the user interface panel. This notification includes the alert’s name, price, time, and symbol. The same information can be sent as an email or a mobile notification.
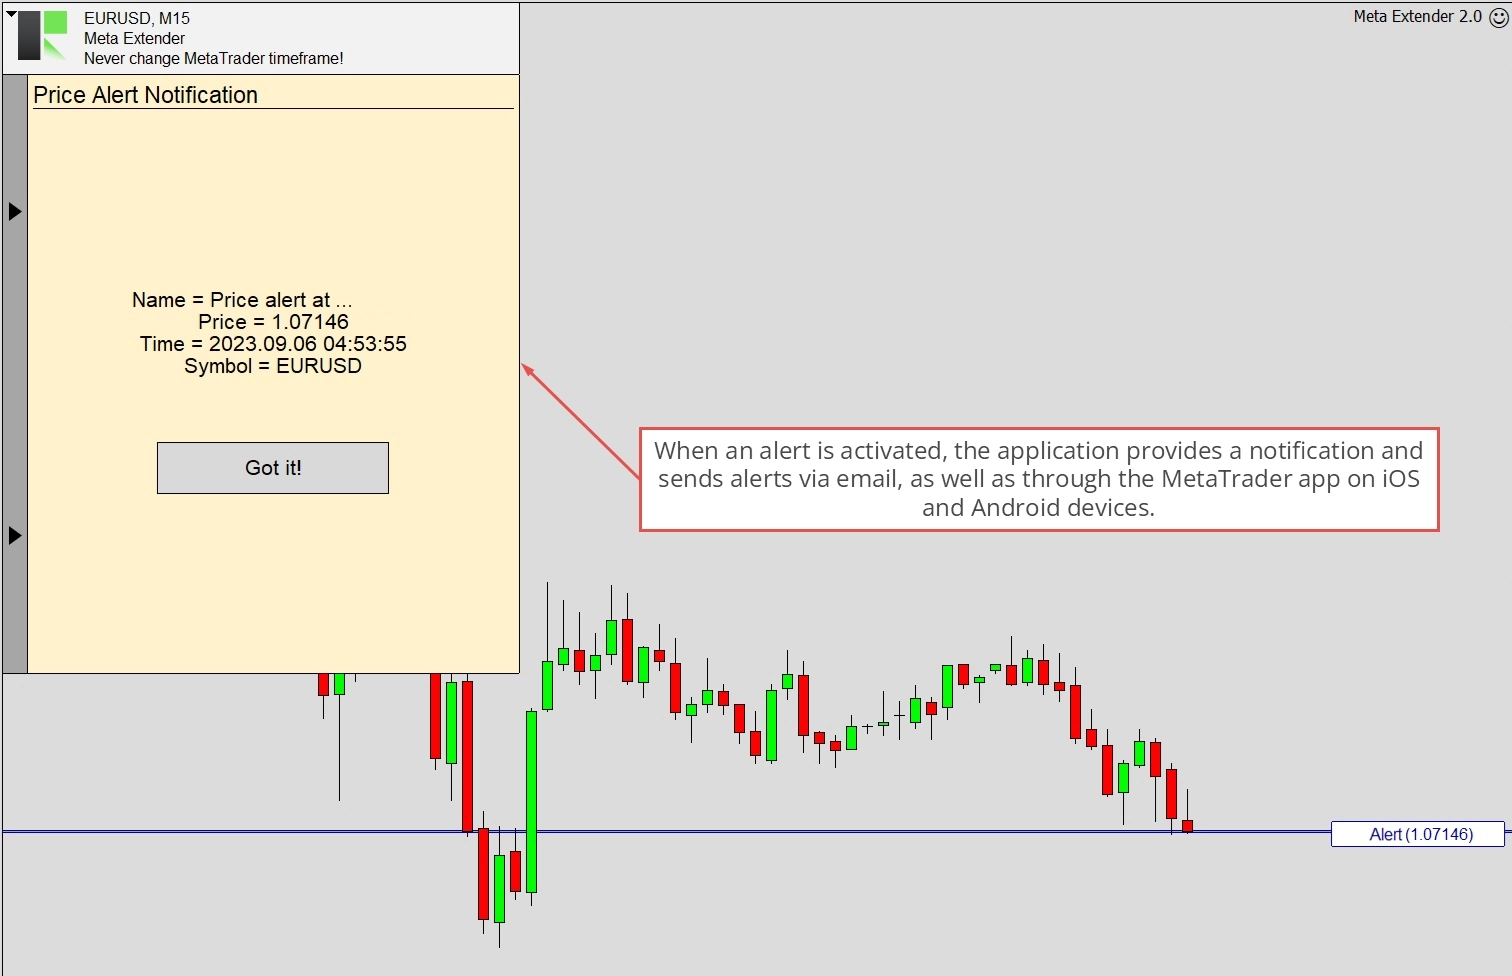
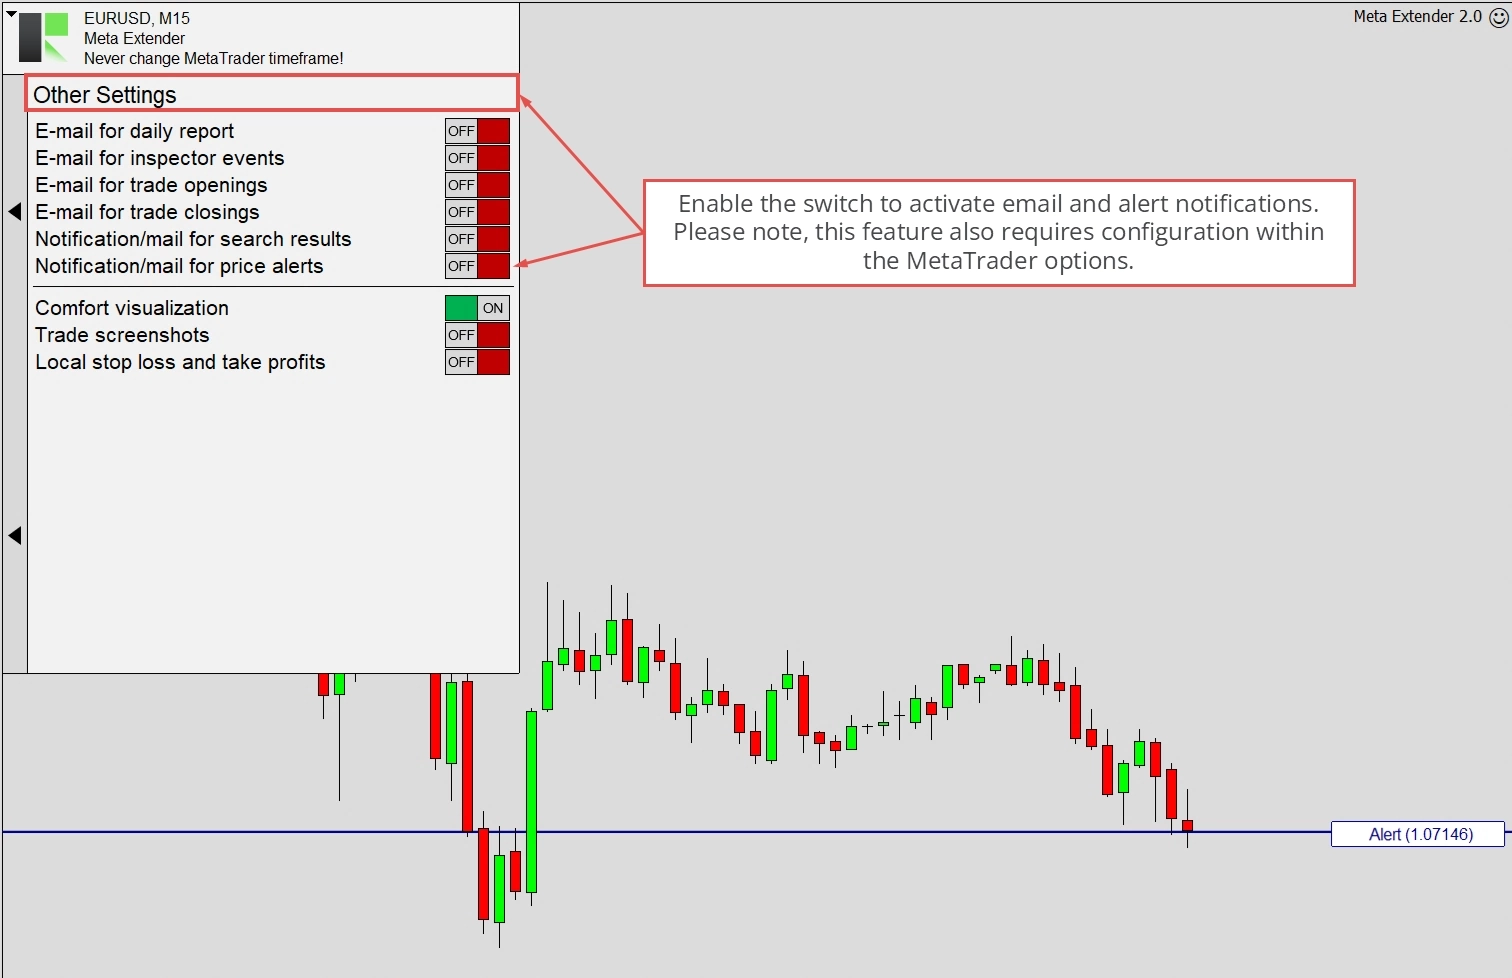
Please note that to receive email and mobile notifications, you must enable the Notification/mail for price alerts in the Other settings widget. Additionally, MetaTrader must be configured correctly. You can find instructions on how to do this here.
Second Timeframe
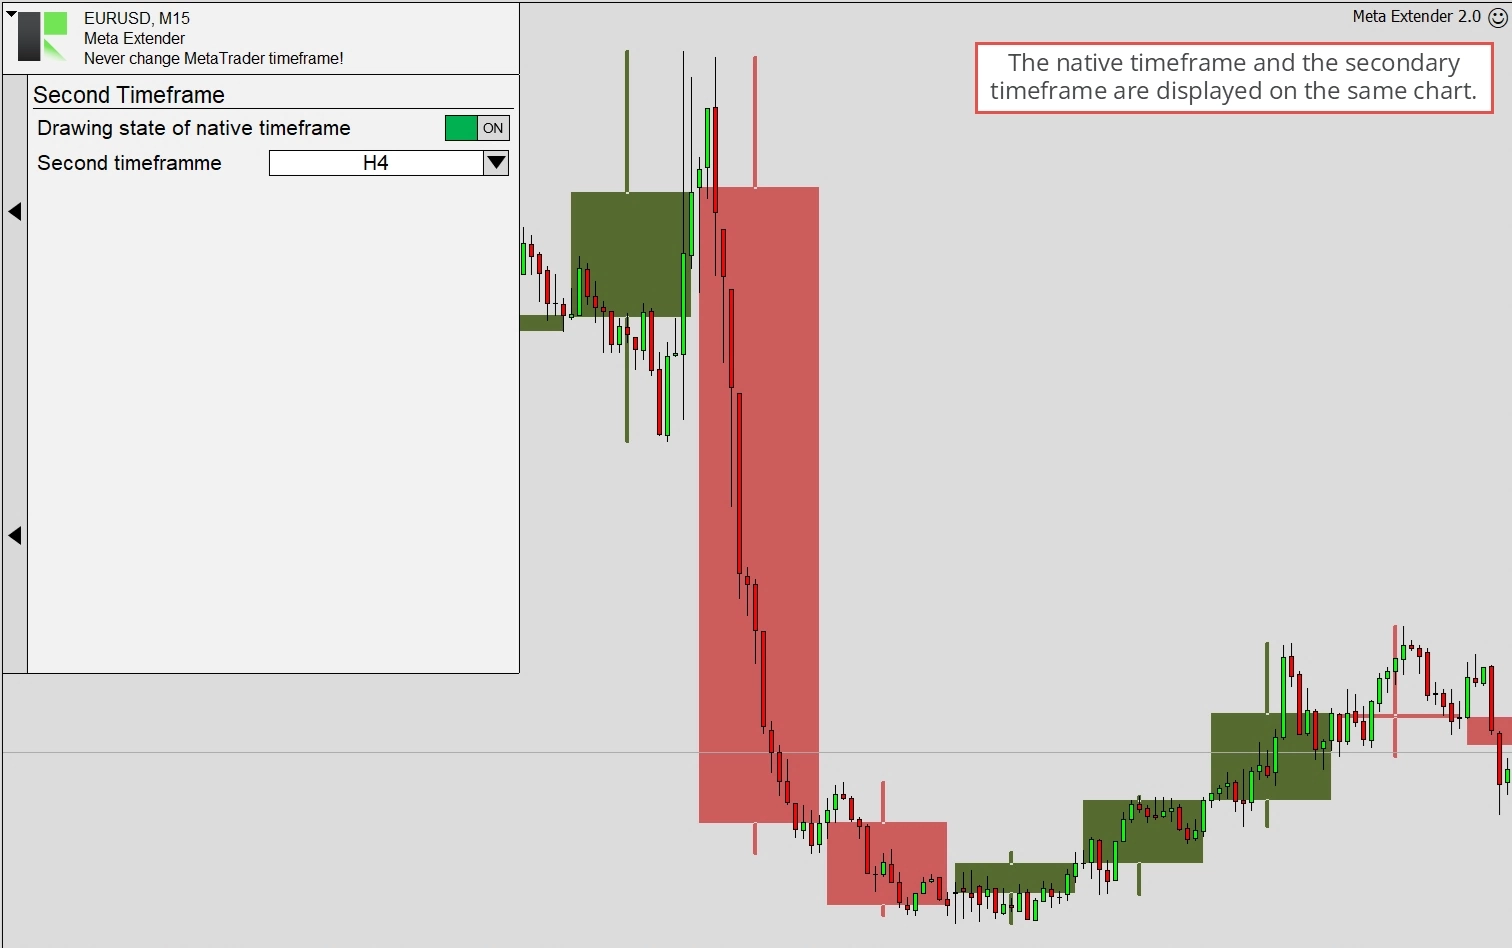
Considering chart movements in a higher timeframe is a crucial practice in trading. This approach is essential to avoid initiating trades that contradict the general trend. Meta Extender provides a feature that allows you to incorporate a higher timeframe into the same chart, offering a comprehensive understanding of the price in relation to your trading timeframe. Please use this feature by opening the Second Timeframe widget from the Meta Extender home screen.
You have two options within this widget: turning off the native timeframe and enabling a higher timeframe. The image below illustrates a EURUSD chart opened in the M15 timeframe with H4 data overlaid as the second timeframe.
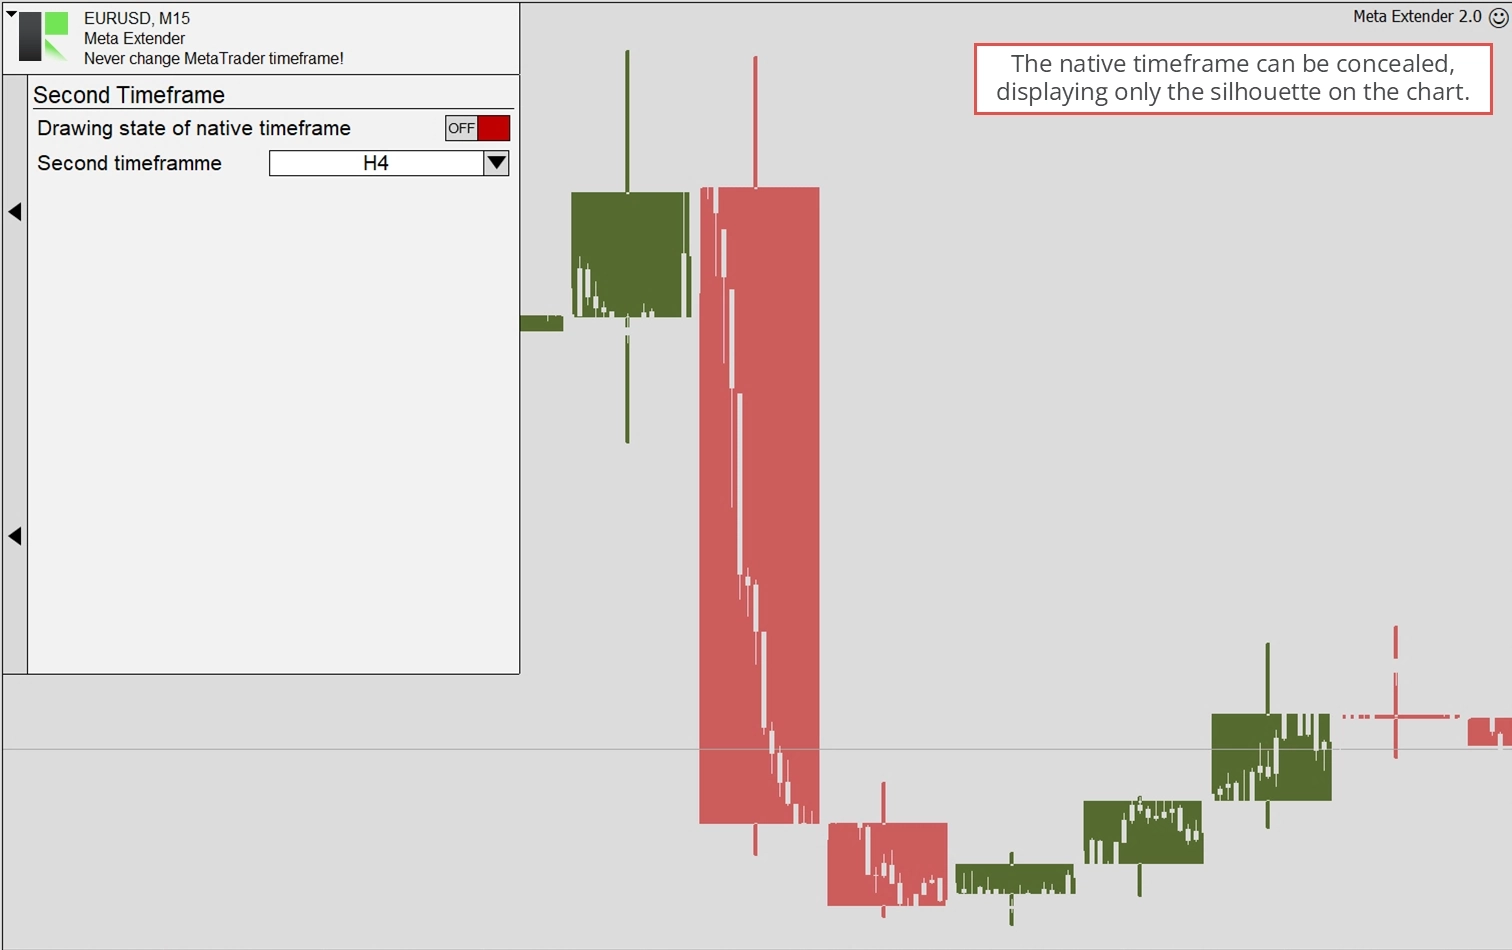
By turning off the native timeframe, you can concentrate solely on the overlaid timeframe. In this setup, the native timeframe is only indirectly visible, as shown below.
Candle Search Results
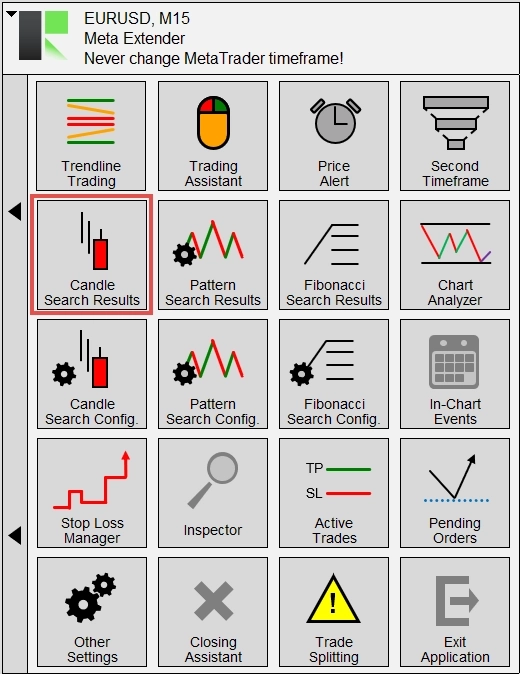
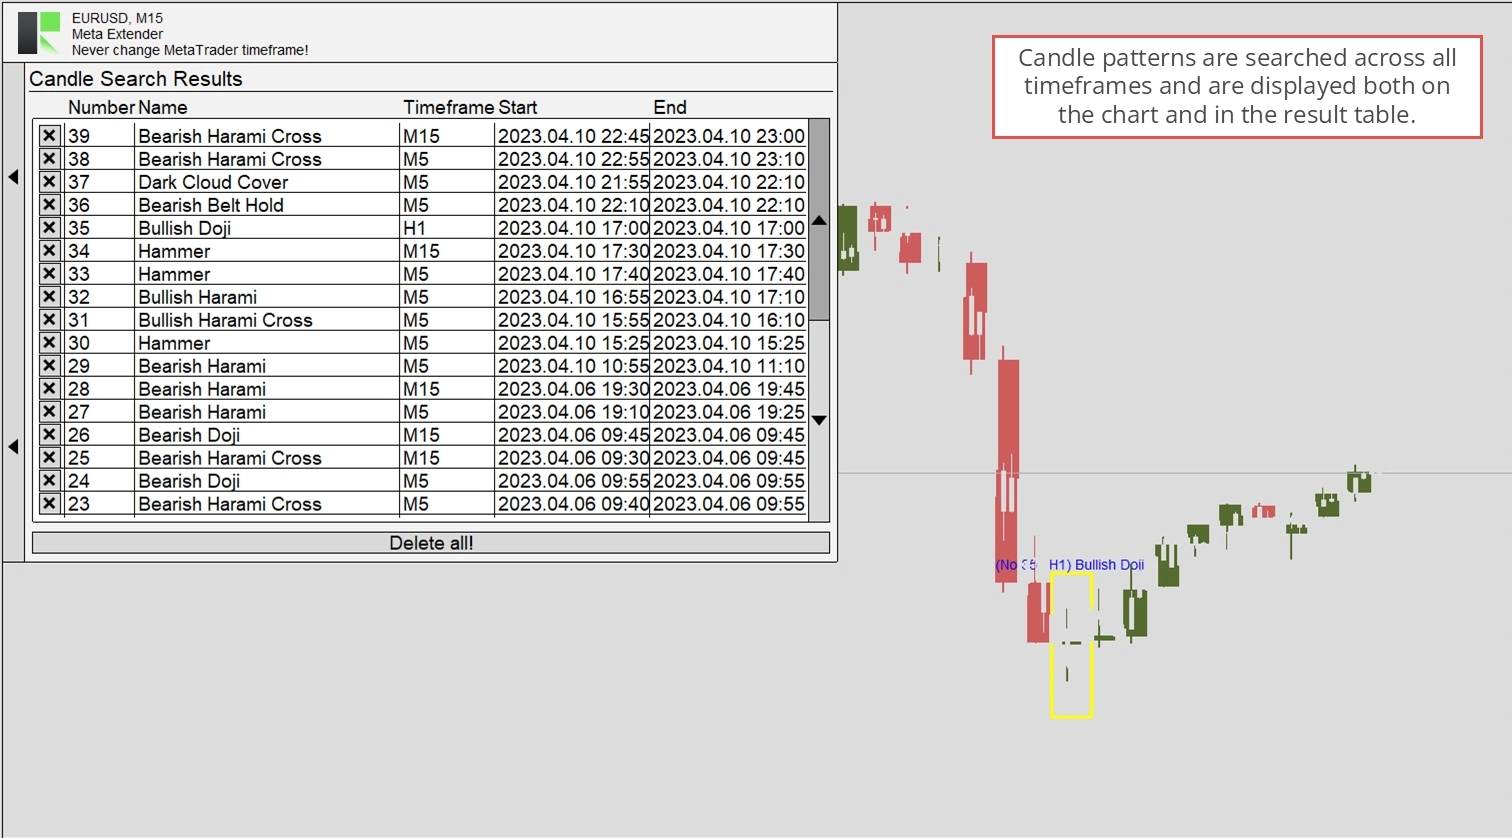
The Meta Extender has a search engine that identifies commonly known candle patterns on the chart. These patterns are searched across all timeframes simultaneously. Each identified pattern is conveniently listed in a table. To access this widget, please press the Candle Search Results button on your home screen.
You can view all the search results and have the option to delete them individually or clear the entire search history.
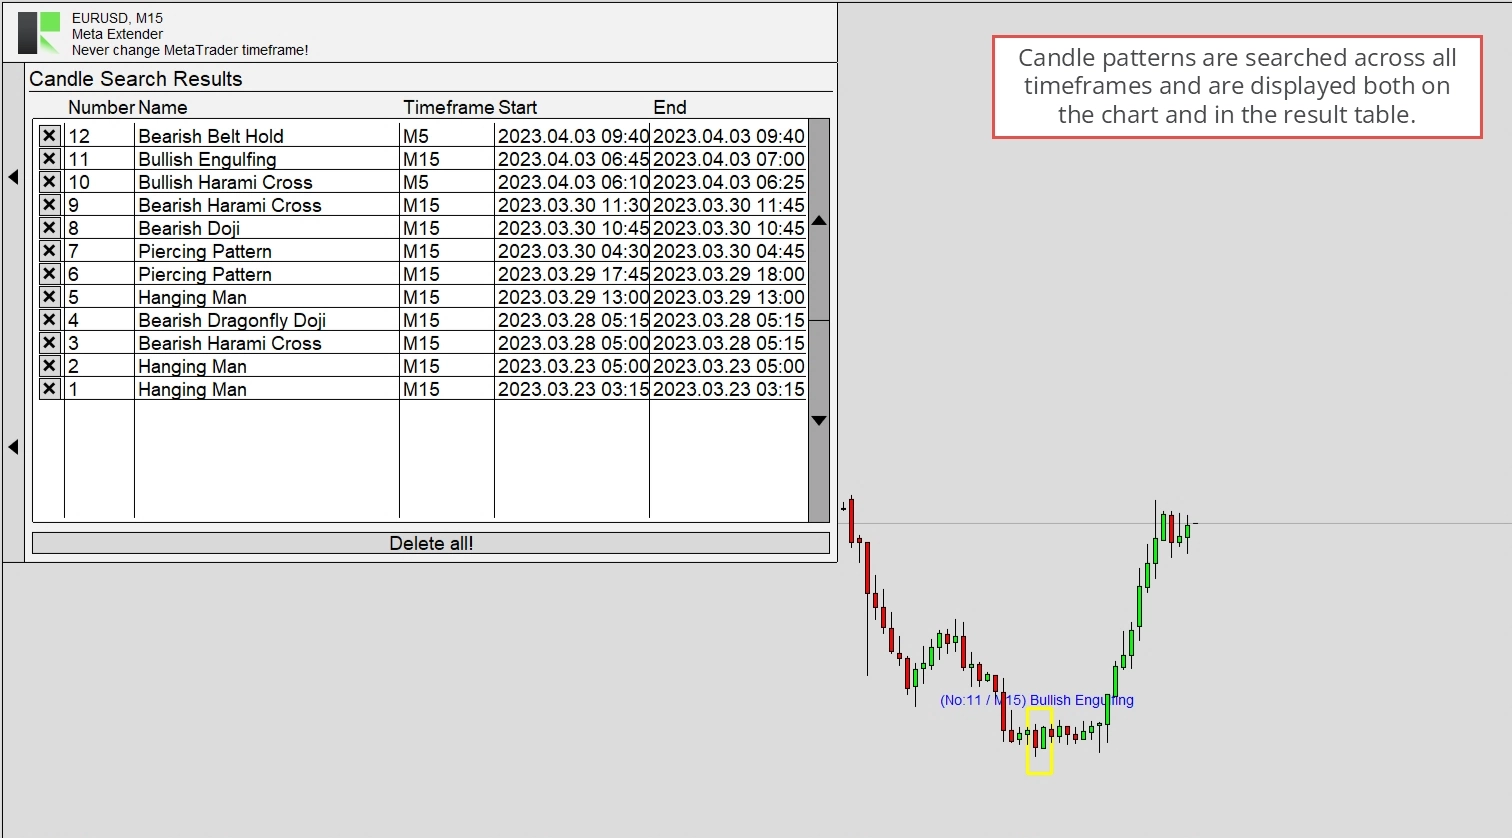
The search results in higher and lower timeframes are only visible when the relevant timeframe is enabled as the Second Timeframe. This will then look similar to the image below.
Pattern Search Results
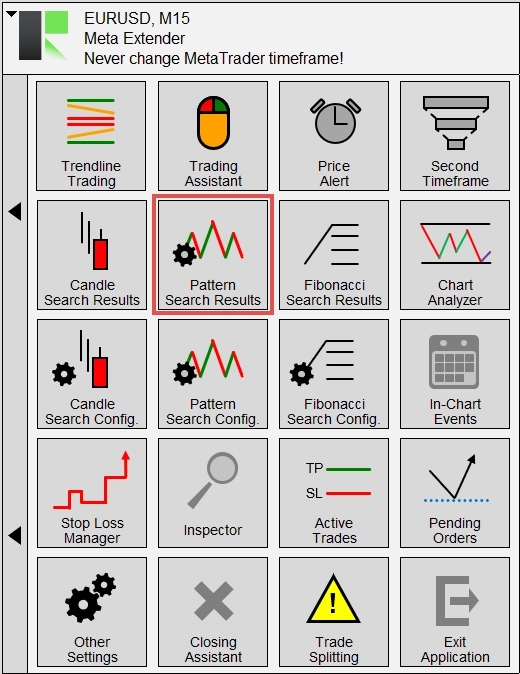
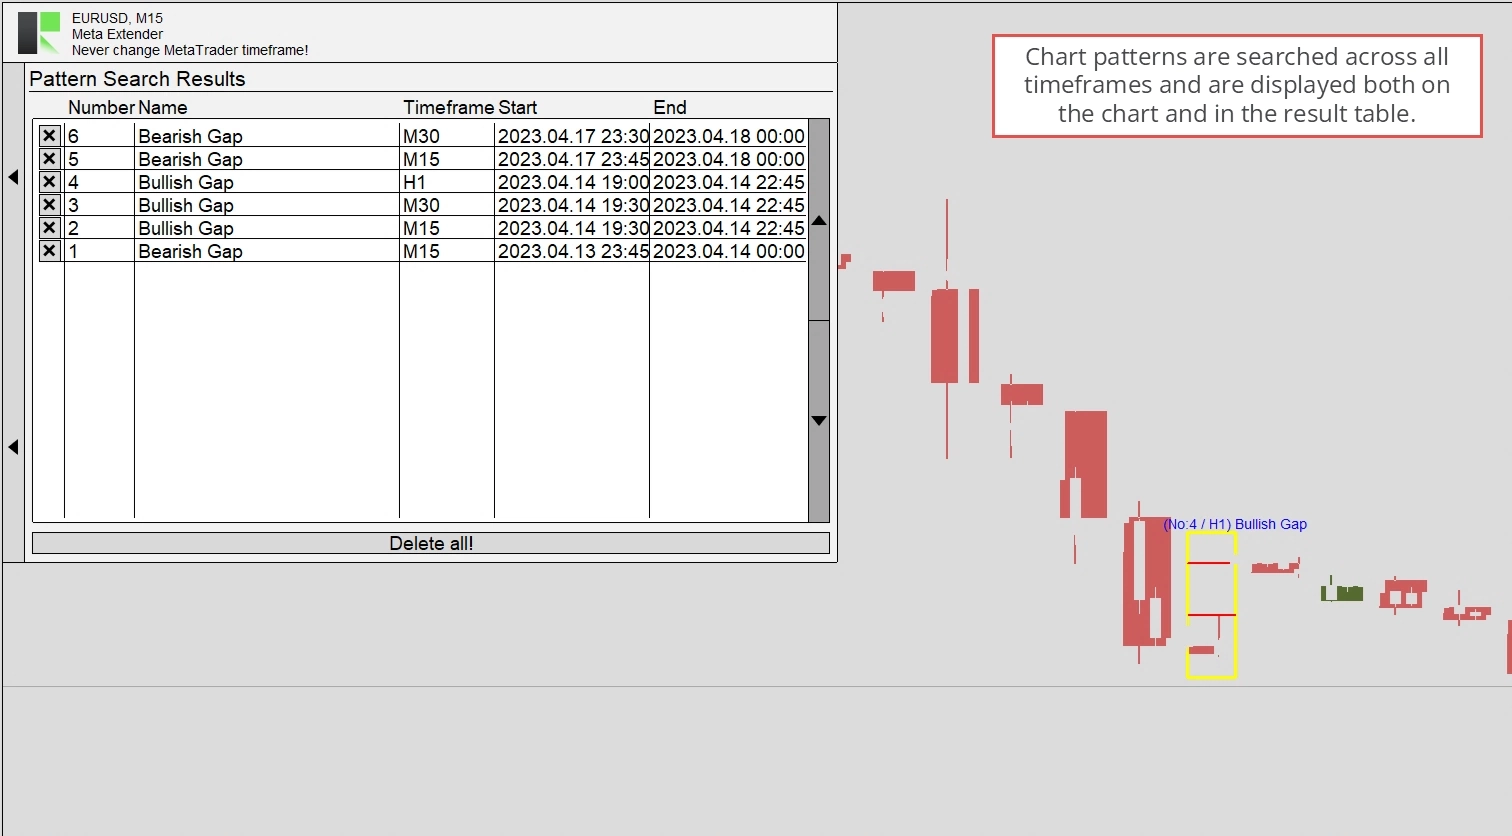
The Meta Extender has a search engine that identifies commonly known chart patterns on the chart. These patterns are searched across all timeframes simultaneously. Each identified pattern is conveniently listed in a table. To access this widget, please press the Pattern Search Results button on your home screen.
You can view all the search results and have the option to delete them individually or clear the entire search history.
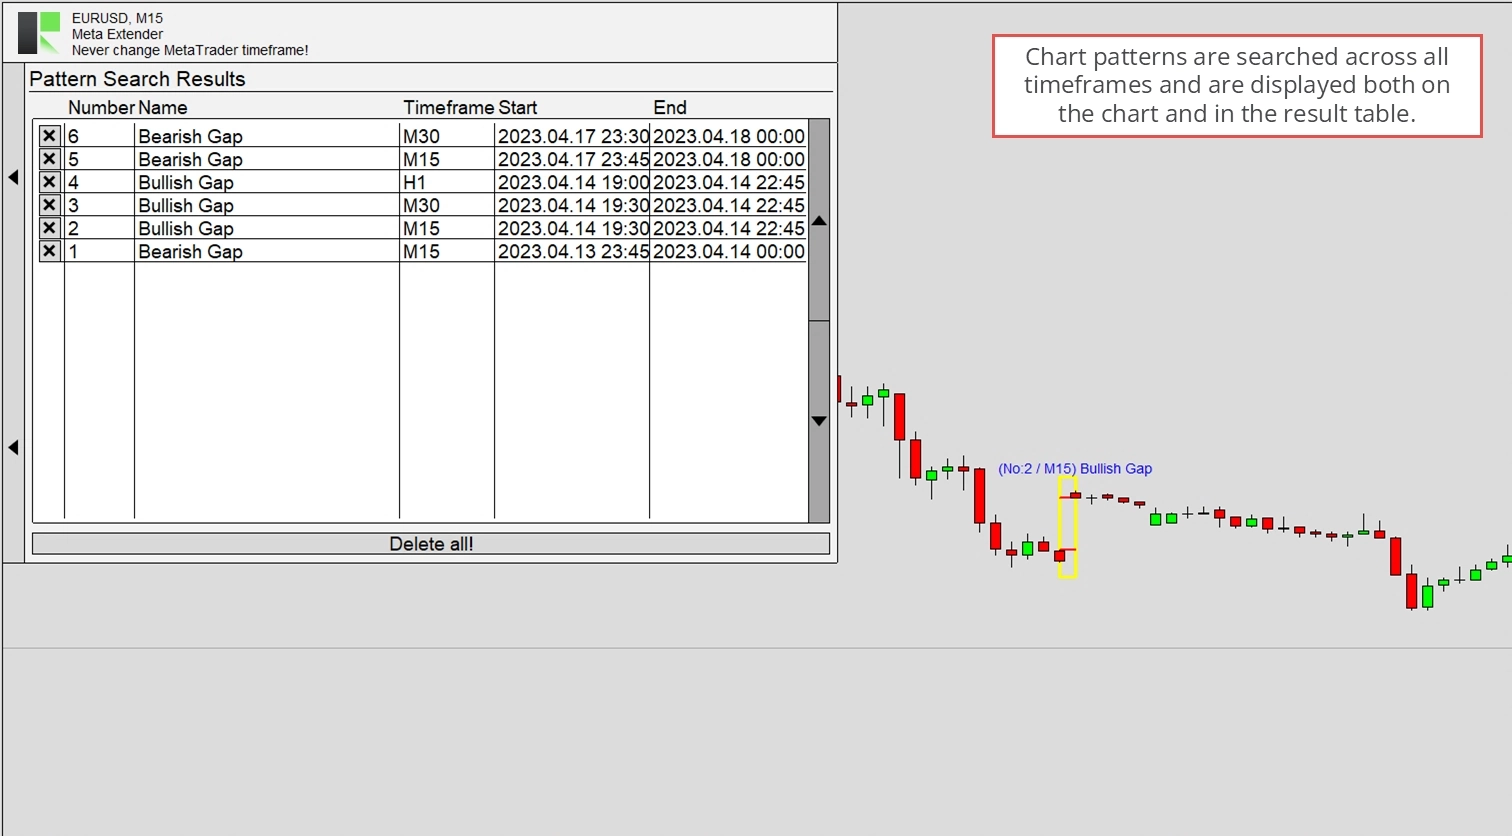
The search results in higher and lower timeframes are only visible when the relevant timeframe is enabled as the Second Timeframe. This will then look similar to the image below.
Fibonacci Search Results
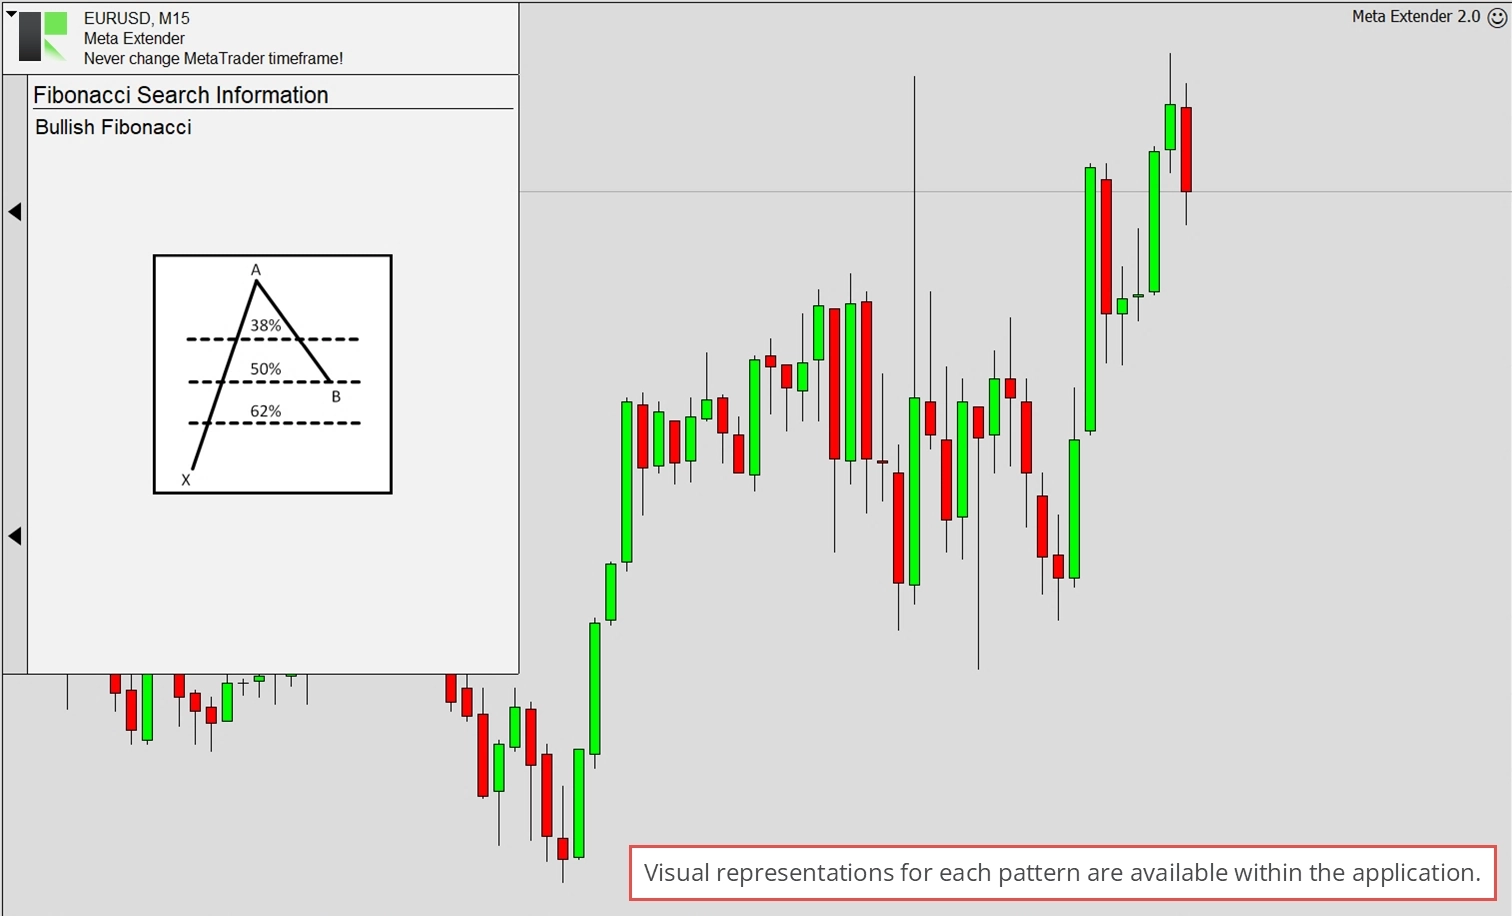
The Meta Extender has a search engine that identifies commonly known Fibonacci patterns on the chart. These patterns are searched across all timeframes simultaneously. Each identified pattern is conveniently listed in a table. To access this widget, please press the Fibonacci Search Results button on your home screen.
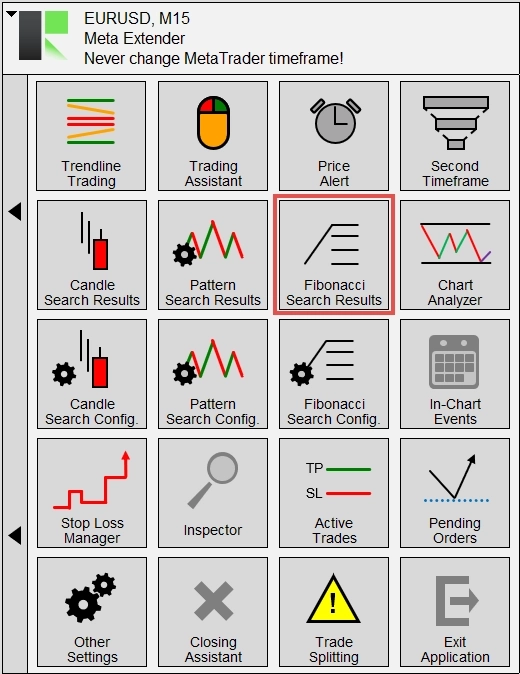
You can view all the search results and have the option to delete them individually or clear the entire search history.
The search results in higher and lower timeframes are only visible when the relevant timeframe is enabled as the Second Timeframe. This will then look similar to the image below.
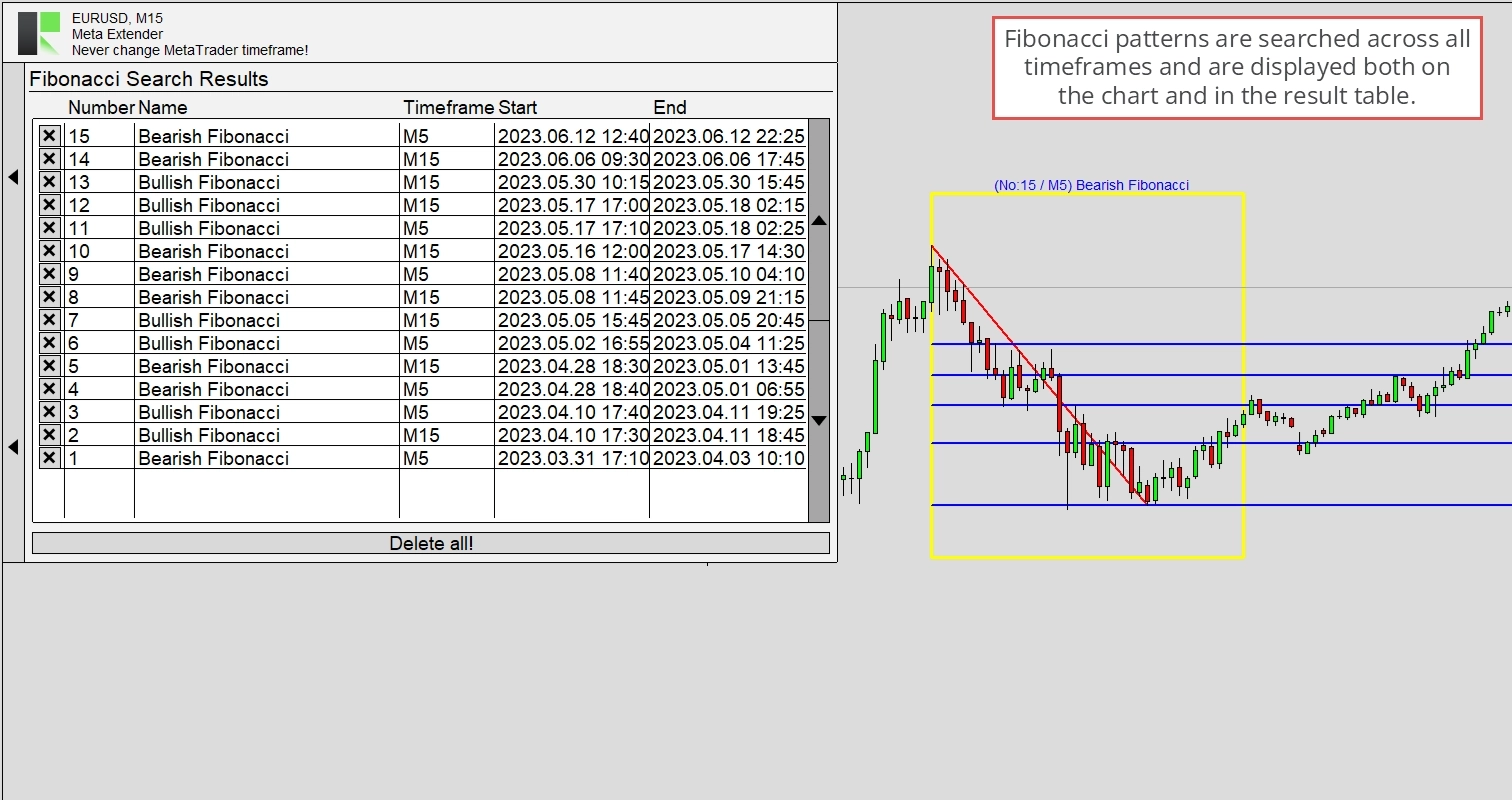
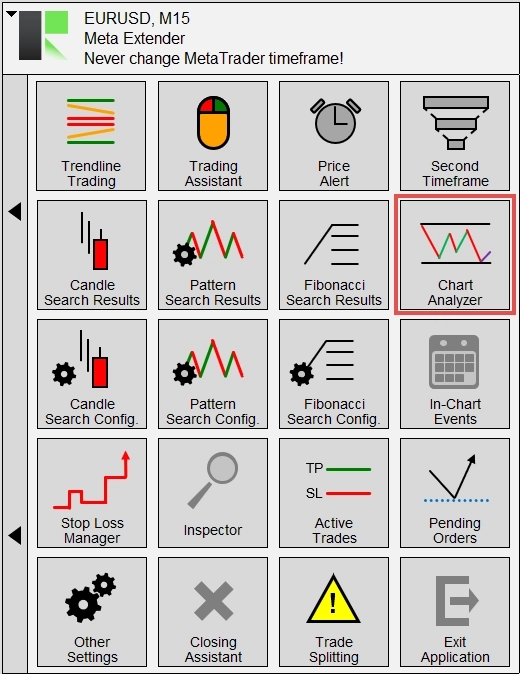
Chart Analyzer
The Chart Analyzer widget is a highly interactive tool that enables you to analyze the current chart for support and resistance levels and provides numerous settings for convenient analysis of the current market phase, retracement level, and more. All input parameters can be adjusted while the application is active.
To access the widget, select Chart Analyzer on your home screen.
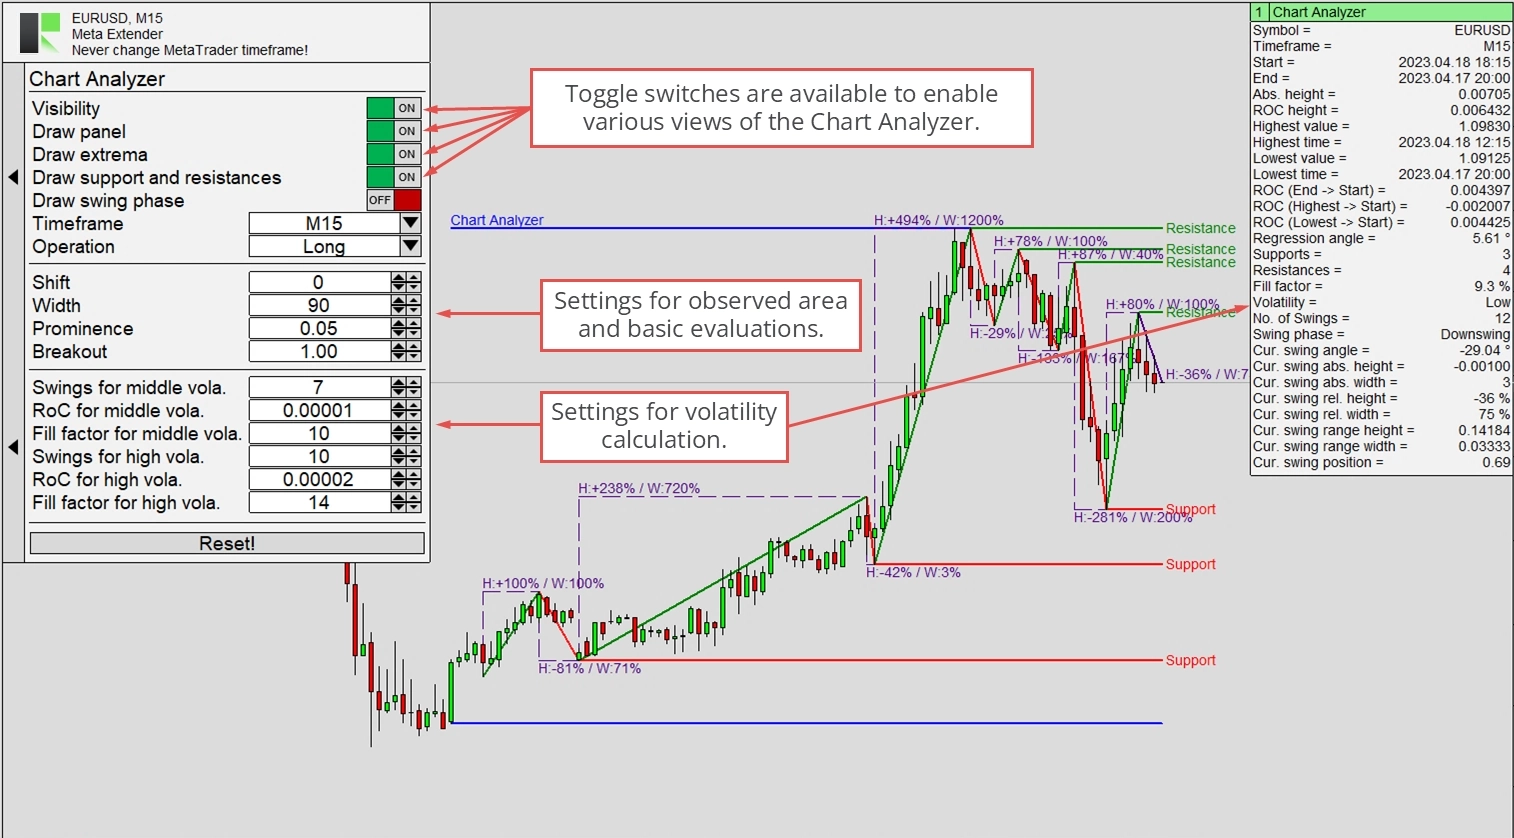
The widget includes various input settings, which are divided into parameters for turning visual elements on and off, configuring the precision of the analysis, and adjusting for volatility detection. Generally, the default values are already optimized, and there’s no need for adjustments. However, you can use the provided inputs to make changes. The analyzed area will be updated immediately according to the latest configured parameters.
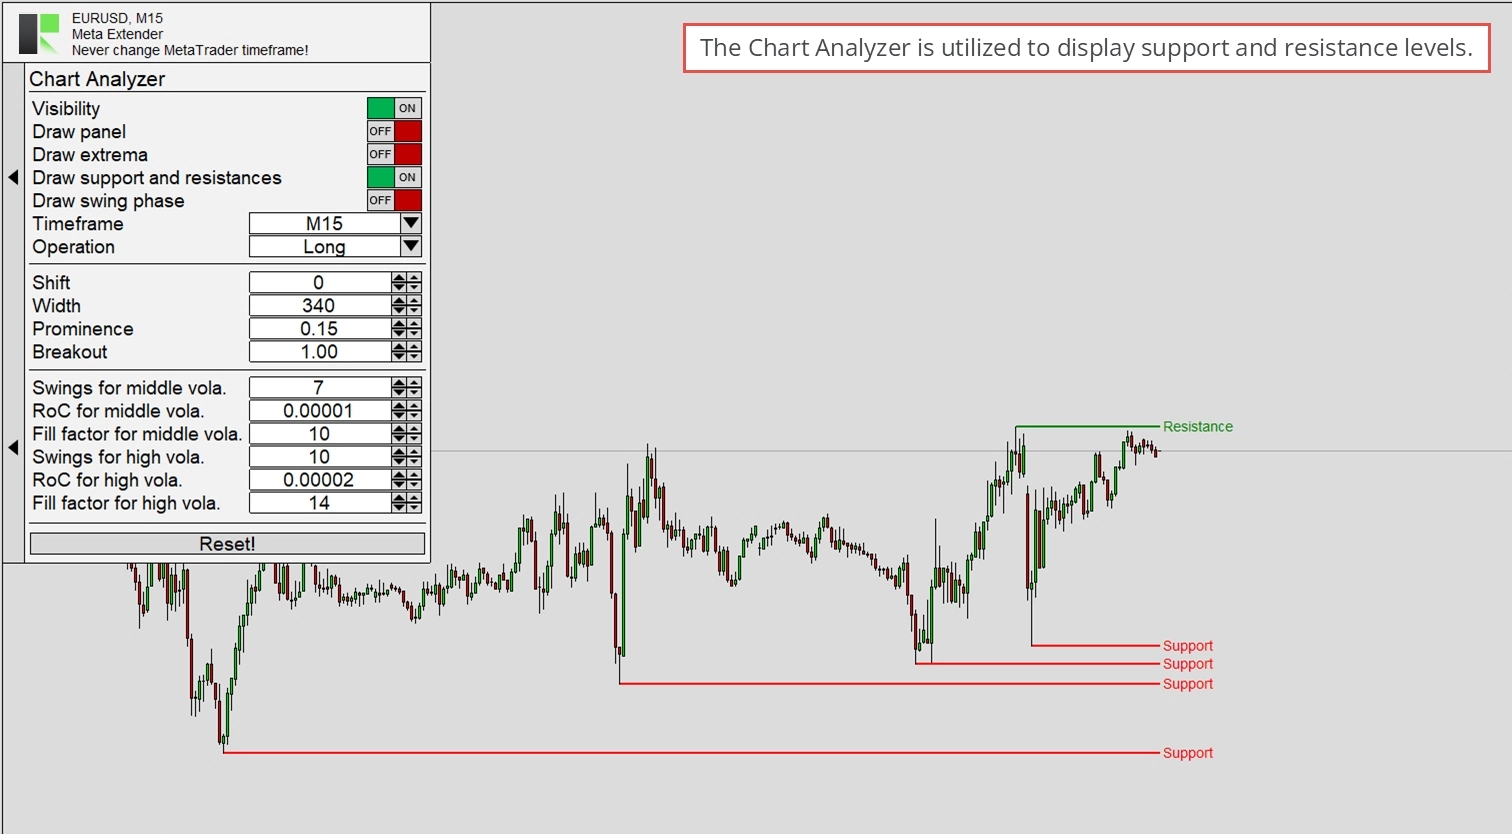
For instance, if you analyze only support and resistance levels, the chart output will look like the following.
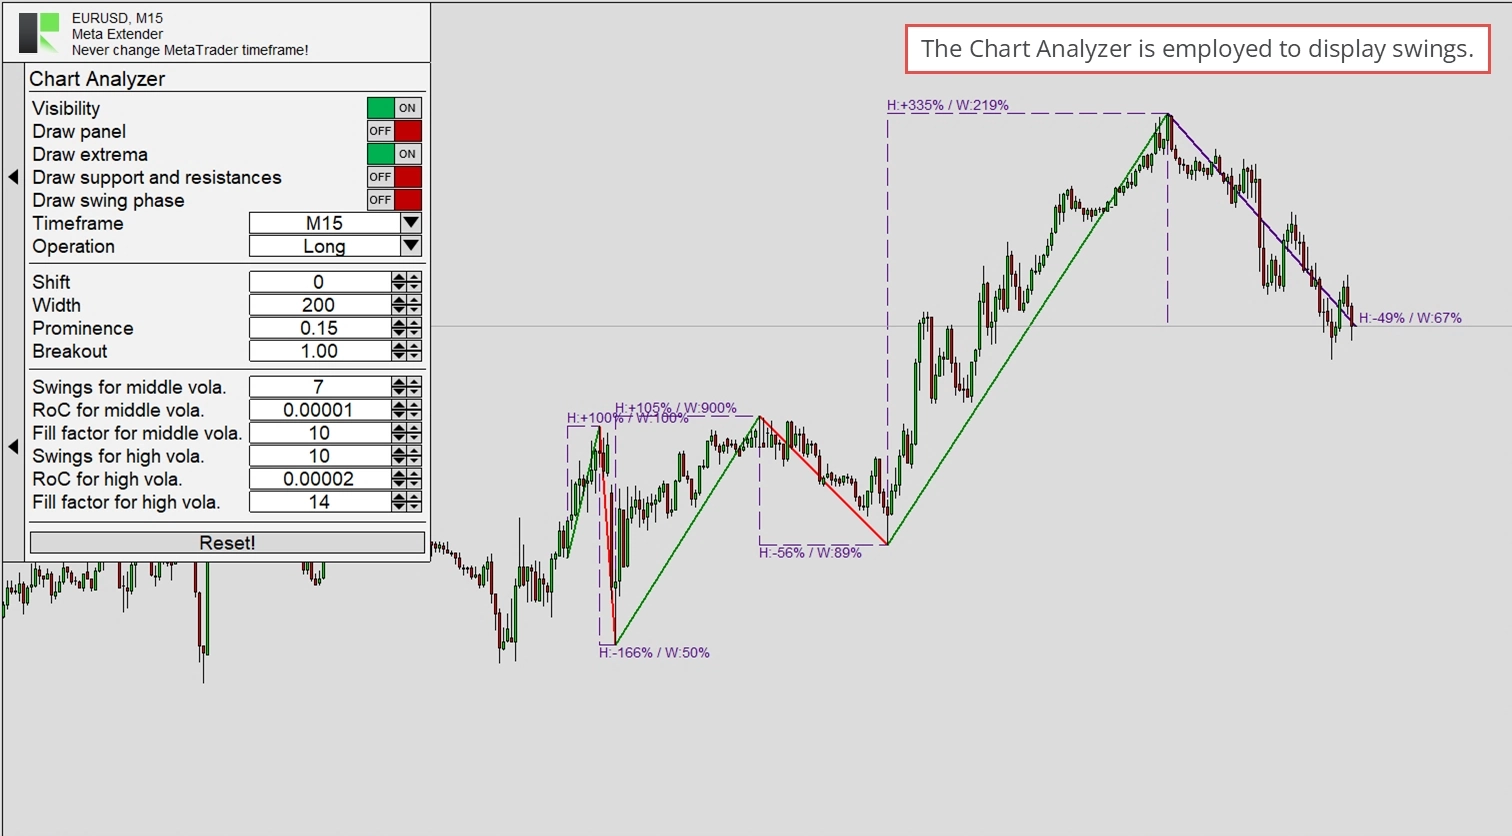
Another option is to calculate and display only the swing phases (ZigZag) and the value of relative changes between each swing.
The configuration of the Chart Analyzer is saved automatically. Thus, the next time you start the Meta Extender on the same symbol again, your Chart Analyzer will automatically restore the previous configuration.
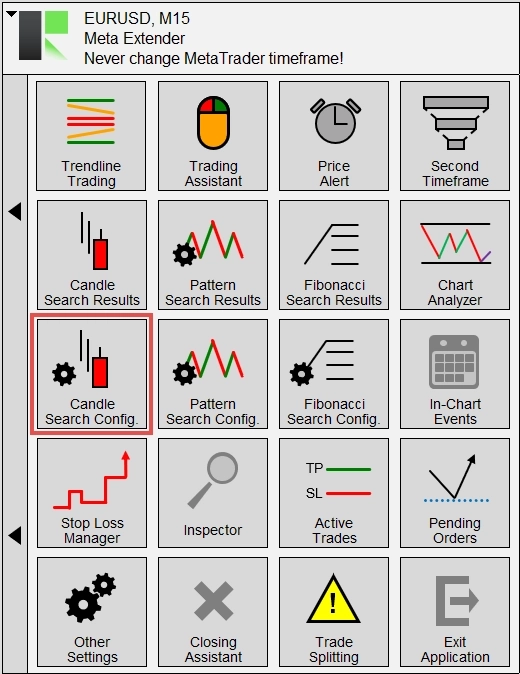
Candle Search Config
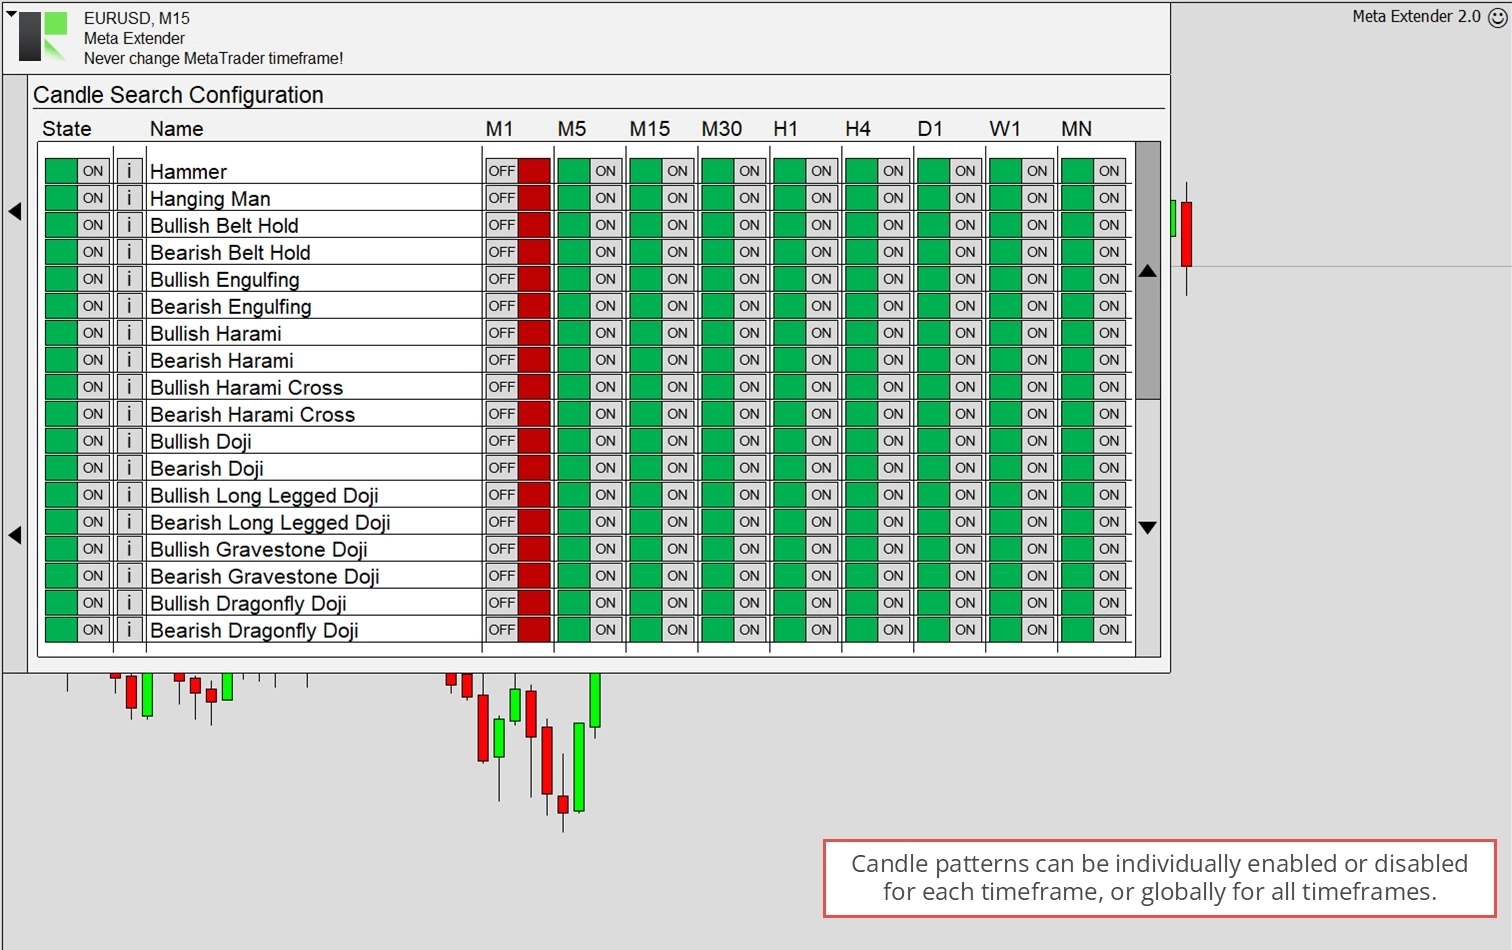
The candle search engine can simultaneously identify patterns across all timeframes. However, you may only want to search for some of them. To customize this, navigate to Candle Search Config, where you can turn each pattern on or off individually.
In this view, you can scroll through all available patterns and disable them for each timeframe individually. These settings will be saved and restored the next time you restart the application on the same symbol.
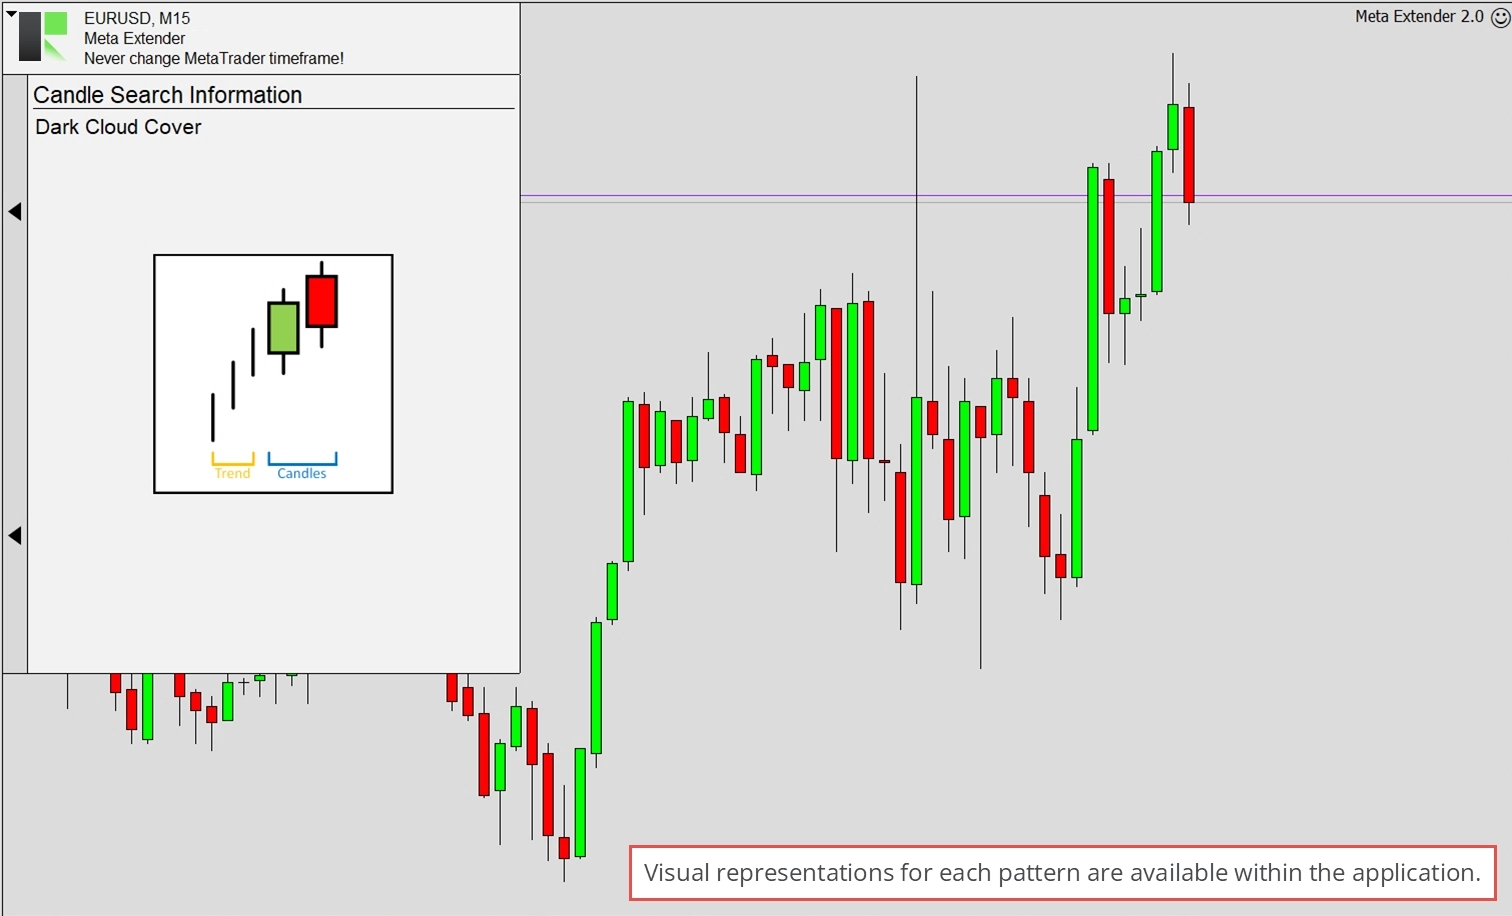
By clicking on the info button, you can view a simple illustration of what each pattern roughly looks like.
The search engine is continuously extended. If a pattern is missing, rest assured that it will be added soon!
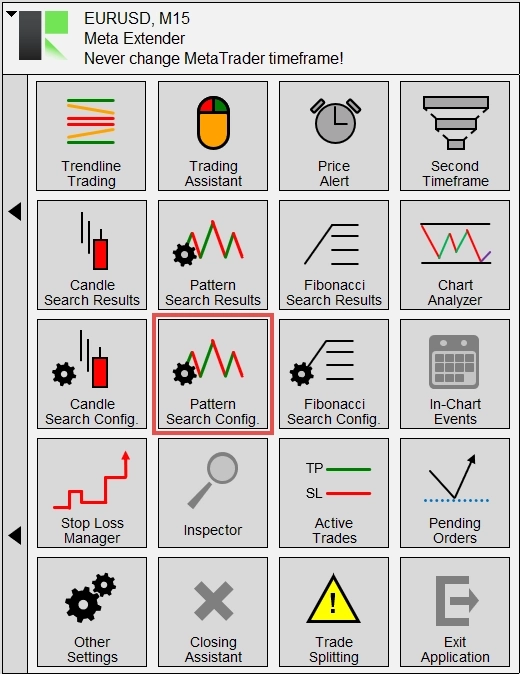
Pattern Search Config
The pattern search engine can simultaneously identify patterns across all timeframes. However, you may only want to search for some of them. To customize this, navigate to Pattern Search Config, where you can turn each pattern on or off individually.
In this view, you can scroll through all available patterns and disable them for each timeframe individually. These settings will be saved and restored the next time you restart the application on the same symbol.
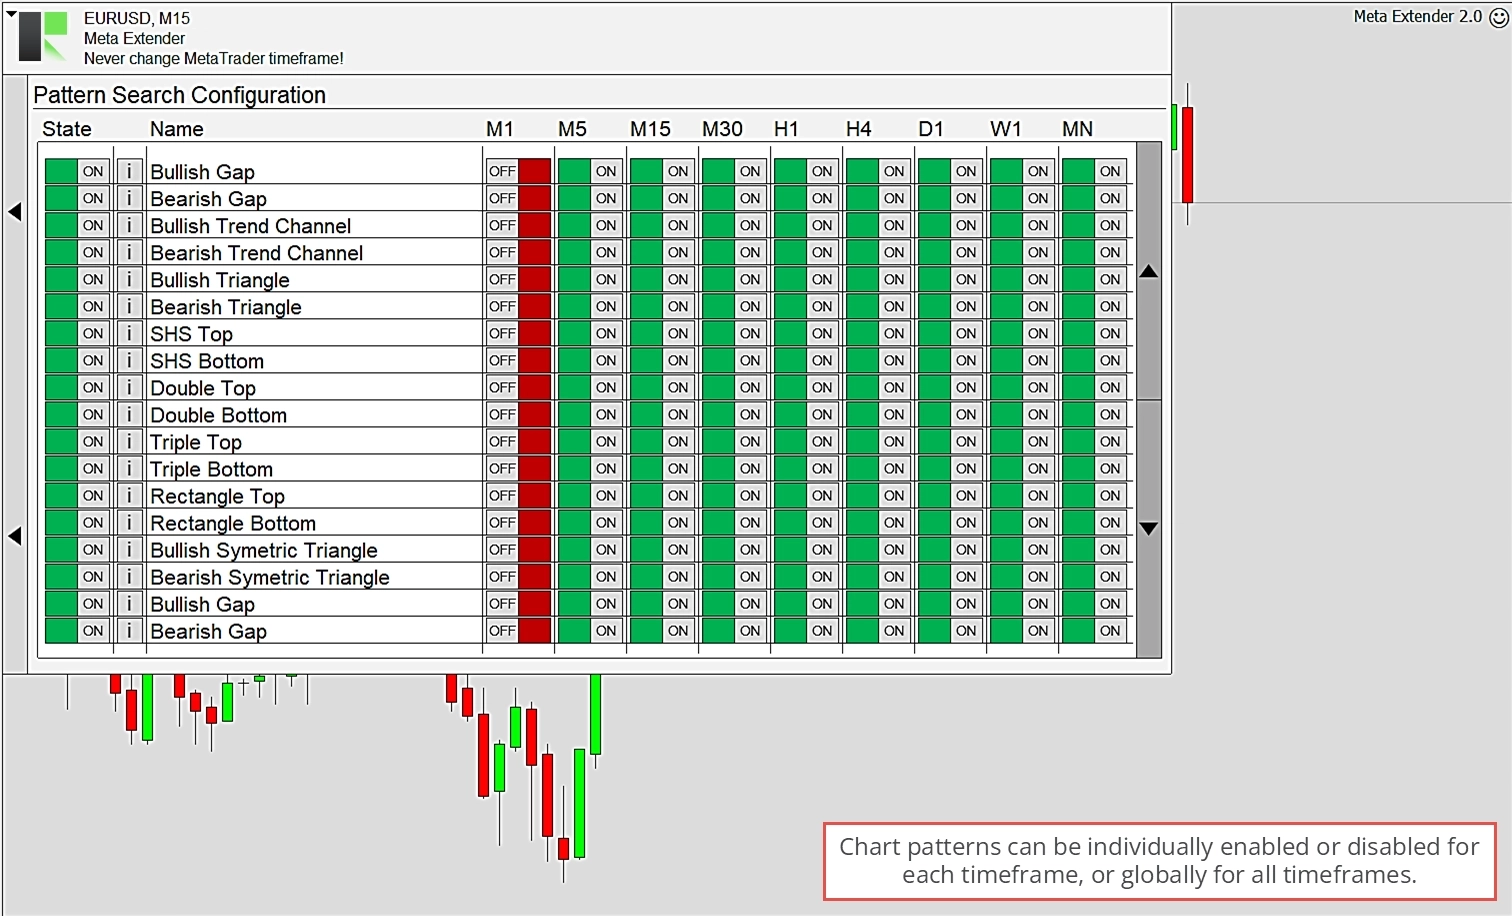
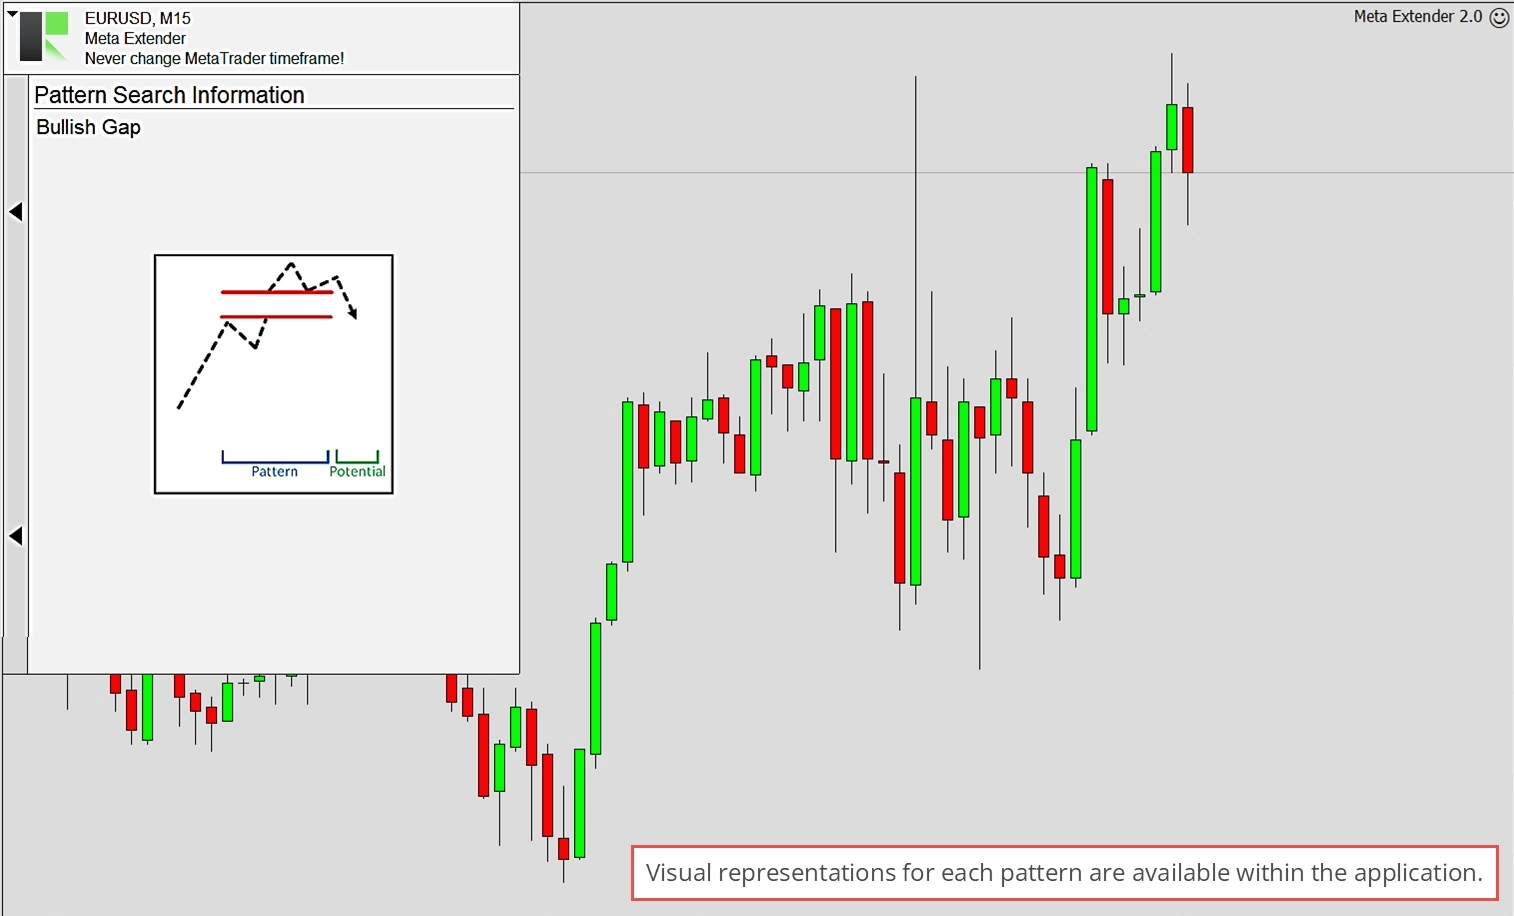
By clicking on the info button, you can view a simple illustration of what each pattern roughly looks like.
The search engine is continuously extended. If a pattern is missing, rest assured that it will be added soon!
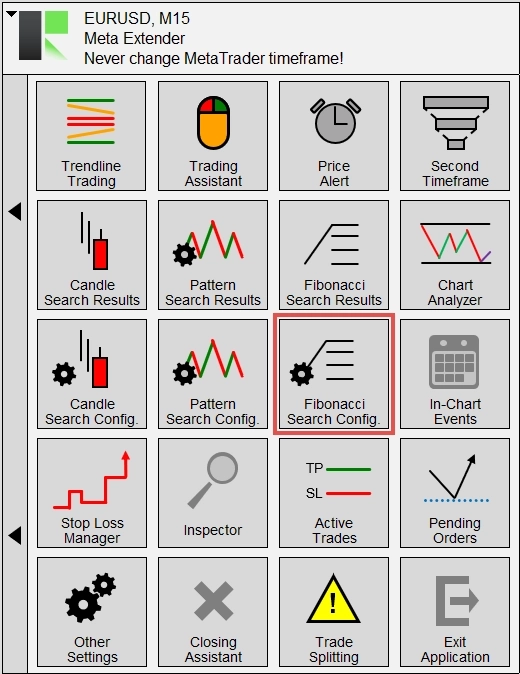
Fibonacci Search Config
The Fibonacci search engine can simultaneously search and identify patterns across all timeframes. However, you may only want to search for them. To customize this, navigate to Fibonacci Search Config, where you can turn each pattern on or off individually.
In this view, you can scroll through all available patterns and disable them for each timeframe individually. These settings will be saved and restored the next time you restart the application on the same symbol.
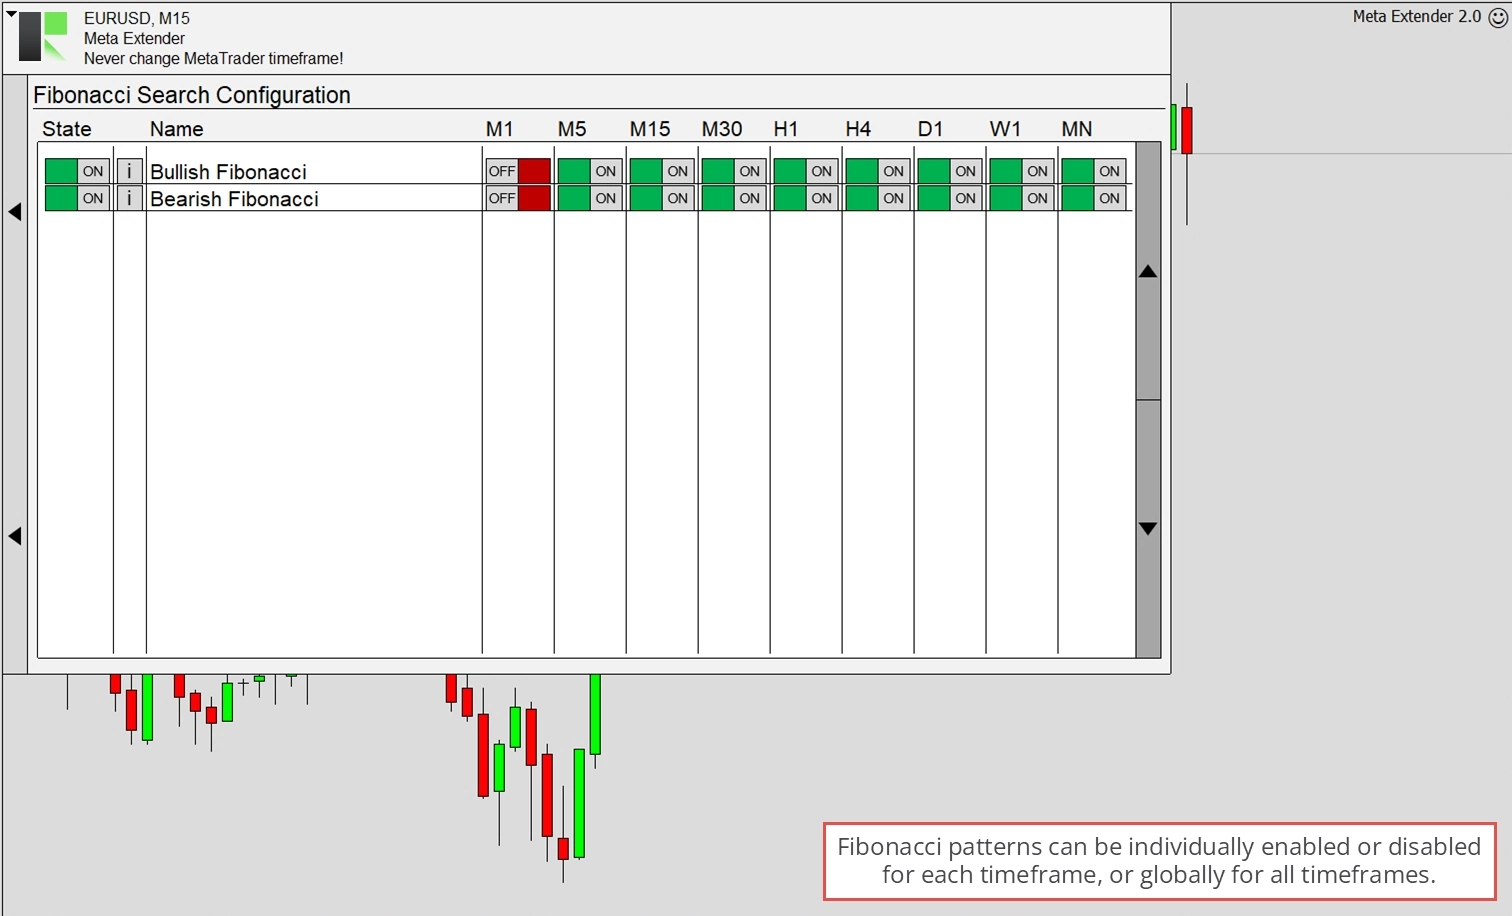
By clicking on the info button, you can view a simple illustration of what each pattern roughly looks like.
The search engine is continuously extended. If a pattern is missing, rest assured that it will be added soon!
In-Chart Events
Undoubtedly, the latest news is one of the most critical factors to consider when trading based on market analysis. Various economic indicators are regularly released and often significantly impact many charts. For instance, the US unemployment rate influences the EURUSD exchange rate greatly, depending on whether the actual results match the forecasts.
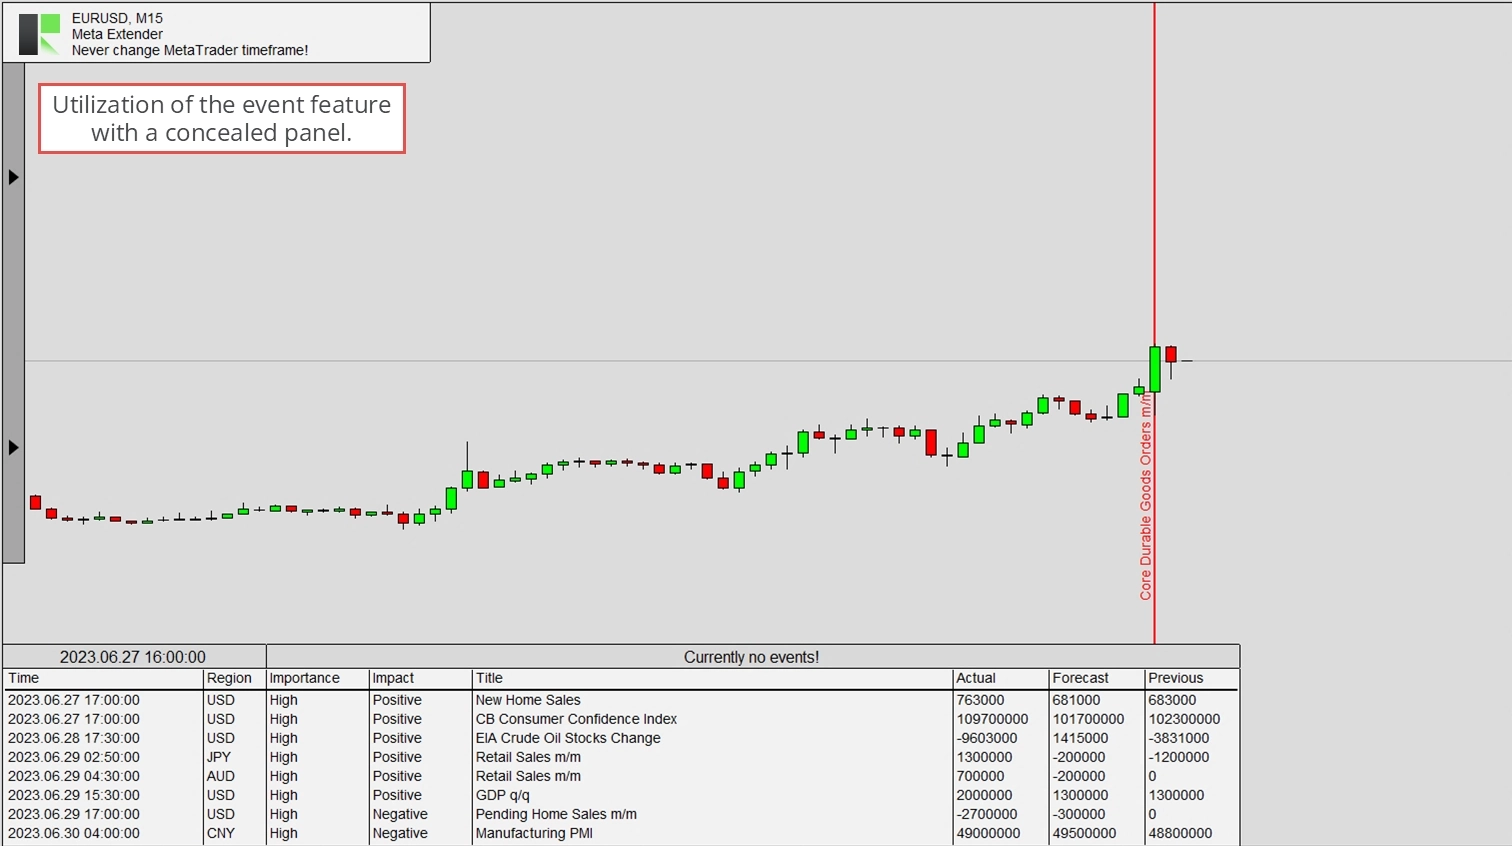
MetaTrader 5 has a built-in economic calendar to inform you about all news events. Unfortunately, MetaTrader 4 has not had this feature until now! The Meta Extender widget In-Chart Events allows you to conveniently integrate all types of news as a table or as horizontal lines. This means you will never miss an important news event again, as Meta Extender will display it right in the chart.
To open the In-Chart Events, please navigate accordingly on your Meta Extender home screen.
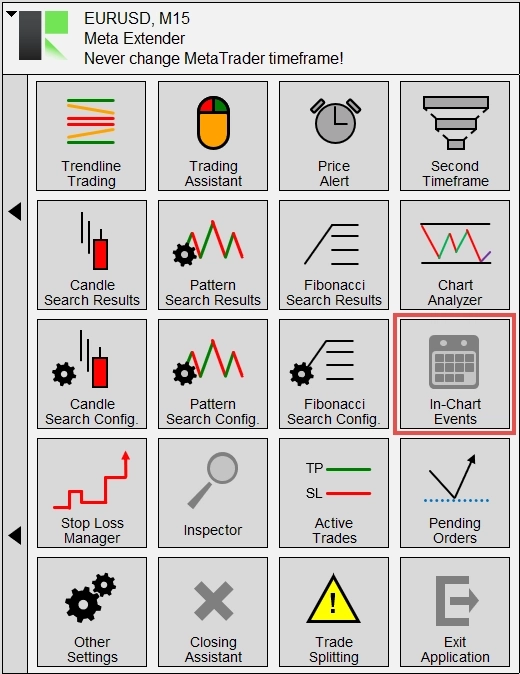
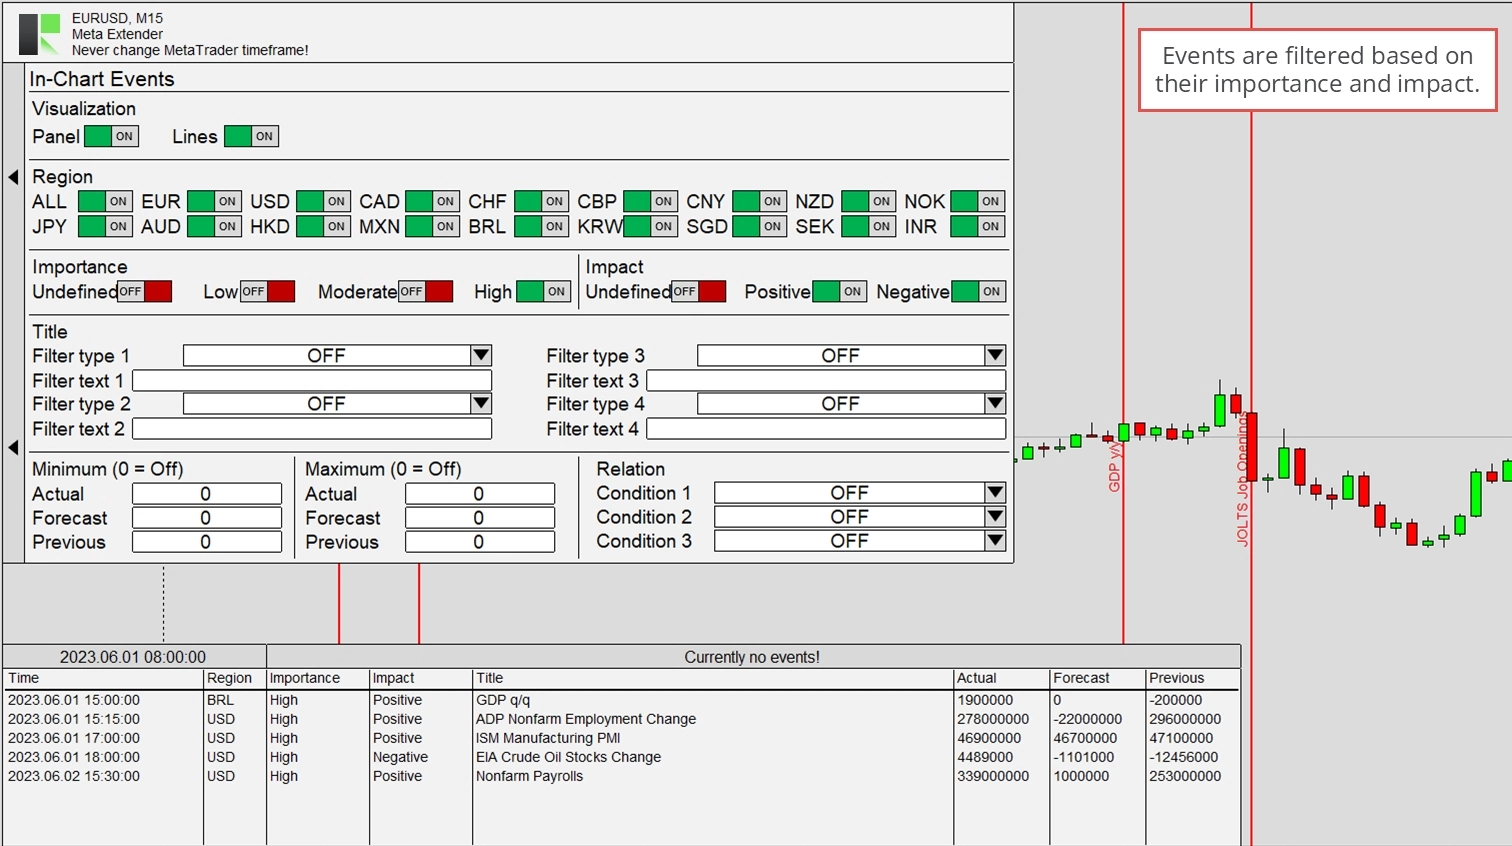
Under Visualization, you can enable the table and the in-chart lines, as shown in the image below, using the switches.

Other filter options for event importance and impact are available as on-off switches. Feel free to get familiar with the feature by using your MetaTrader strategy tester to find the events that matter for your trading strategy.
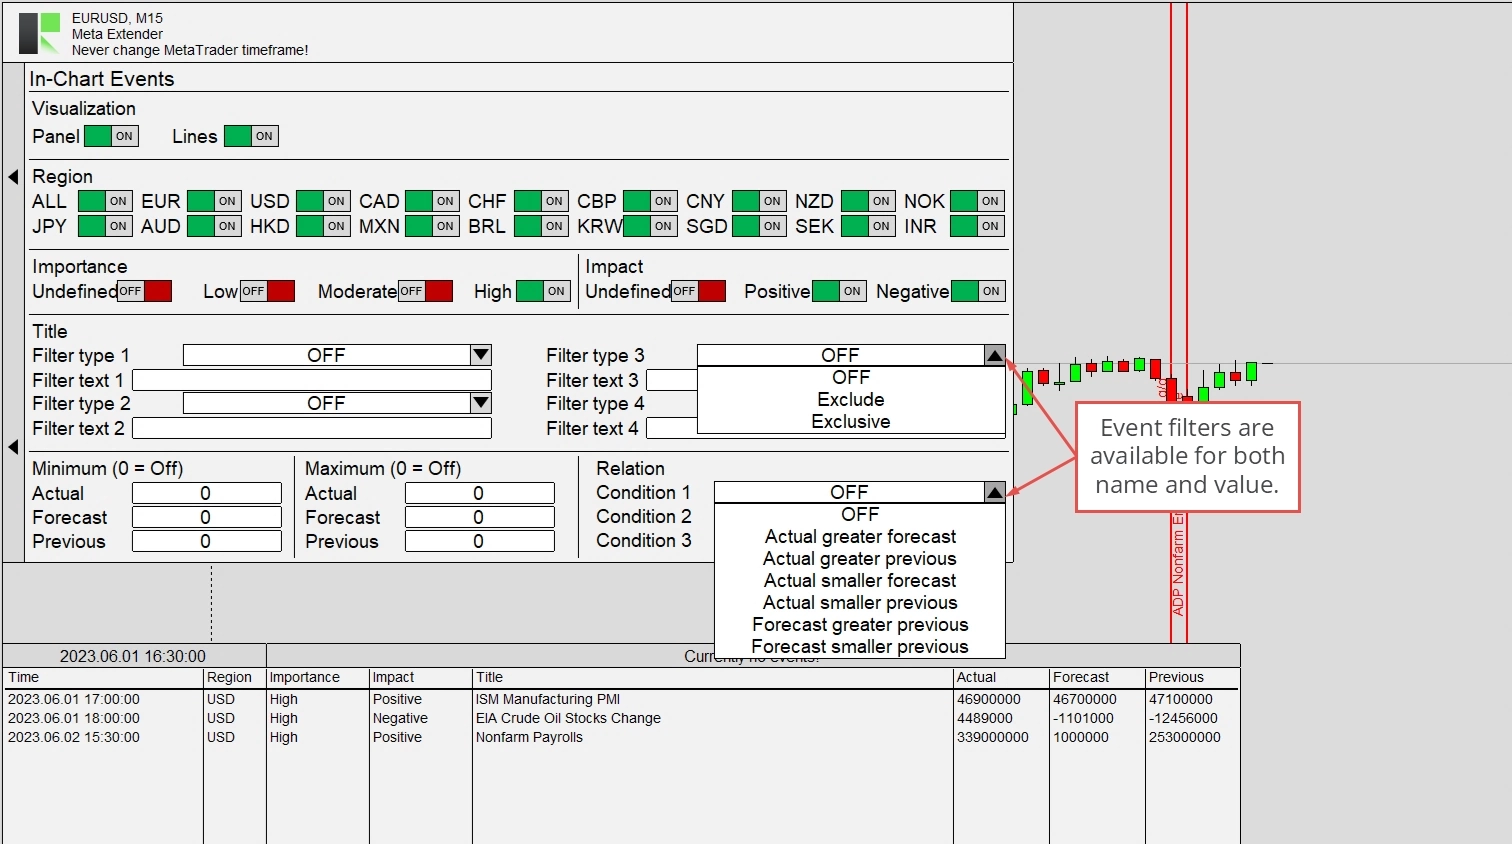
Other filters are available for the event name and the actual value. The parameters listed in the Title section allow you to filter for the names of the events. Here, you can select between Exclude and Exclusive mode. Exclude means that all the events that contain the value from the input field are excluded from the news event list. In contrast, the exclusive mode means only events with the input text contained are shown. For example, if you wish only to be informed about ECB news events, please set Filter type 1 to Exclusive and enter ECB in the Filter text 1 input field.
With the Minimum, Maximum, and Relation input parameters, you can define how the actual, forecast, and previous values have to be in absolute or in relation to each other. For example, by selecting Actual greater than previous you get shown only news events where the value of the economic indicator has risen.
The latest news will significantly impact some traders’ daily trading style. Therefore, you can configure the in-chart widgets and then hide the entire panel with the leftmost button.
Please note that news values can be delayed by seconds or minutes. This is due to external dependencies in receiving the economic calendar data.
Meta Extender
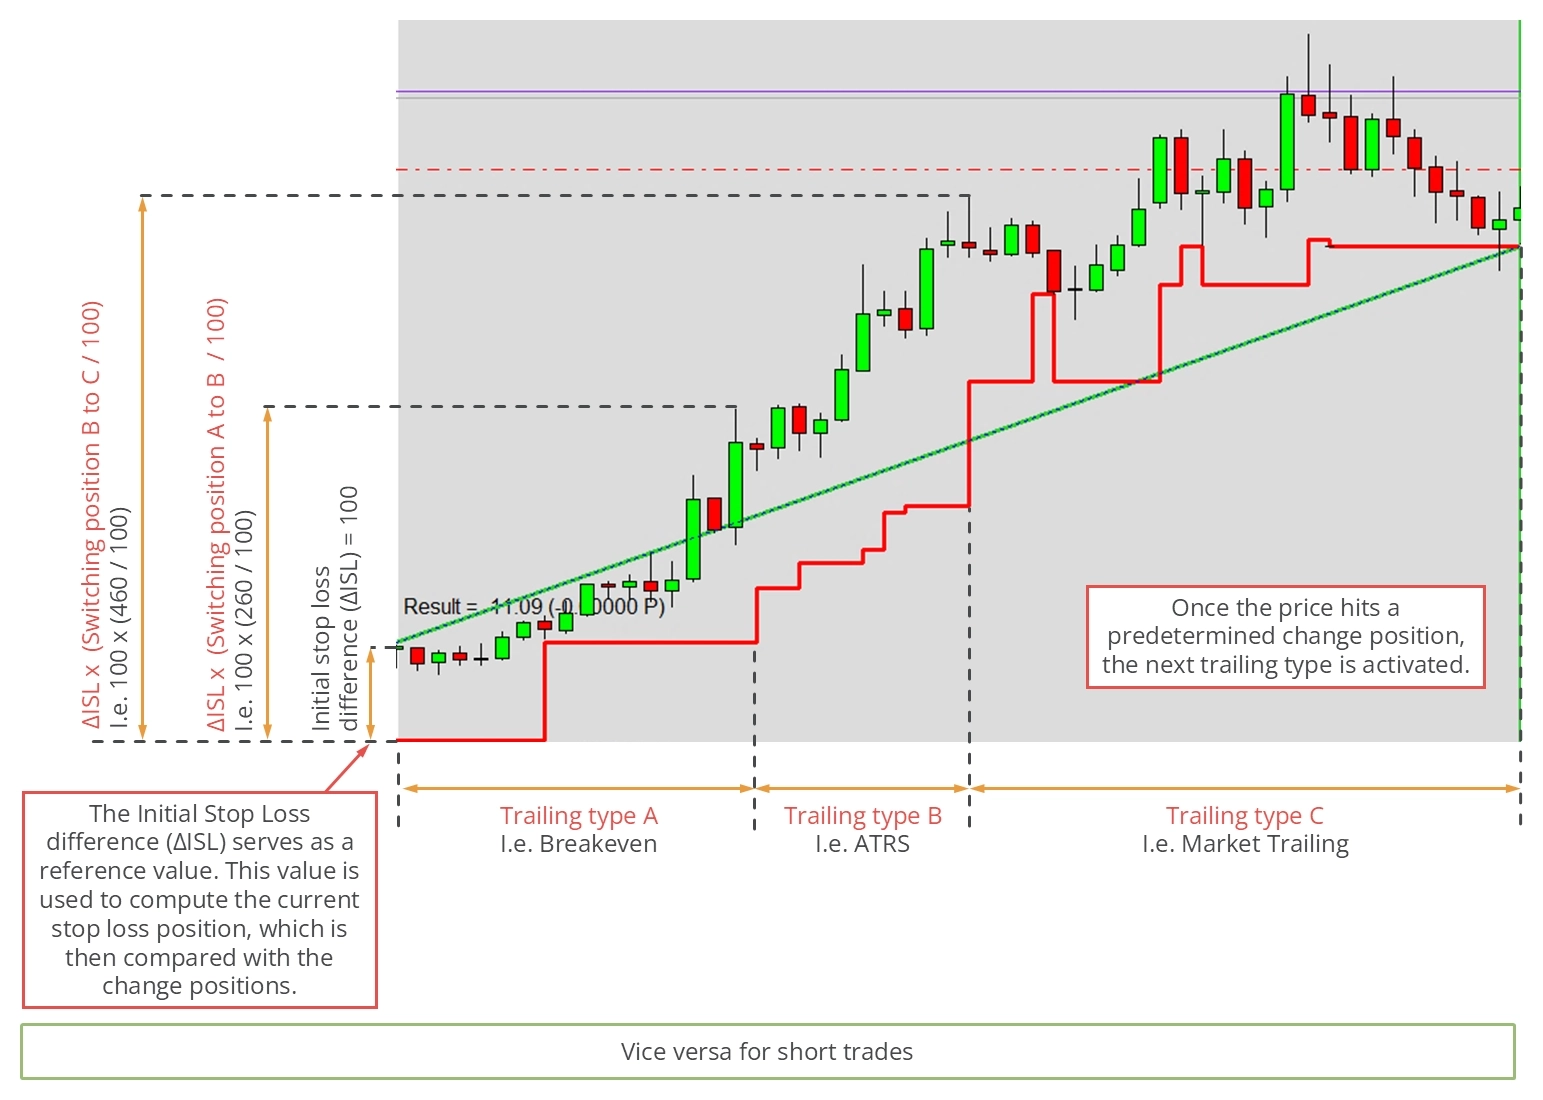
The Meta Extender technology, widely used across the product portfolio, is described below. This technology can function as a standalone tool, in fully automated trading systems, or as part of the Meta Extender. The Meta Extender integrated into the Meta Extender offers professional capabilities to automate stop loss trailing. This includes the selection of the actual stop loss trailing method and even the transition between them once a trade is opened.
You can access the widgets by clicking the Meta Extender button on your Meta Extender home screen.
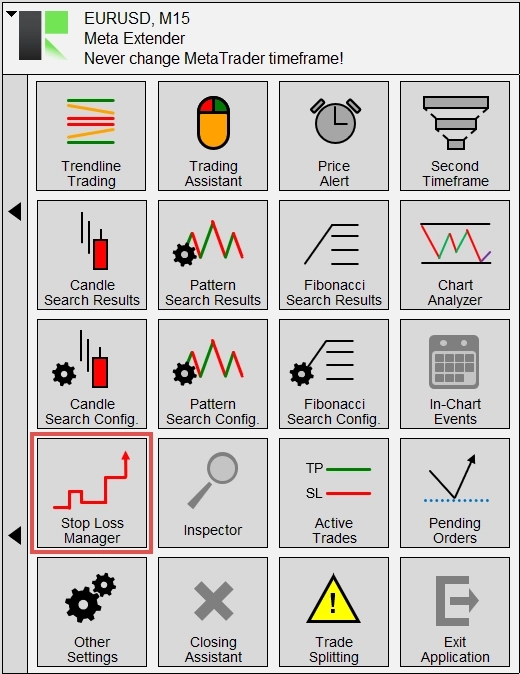
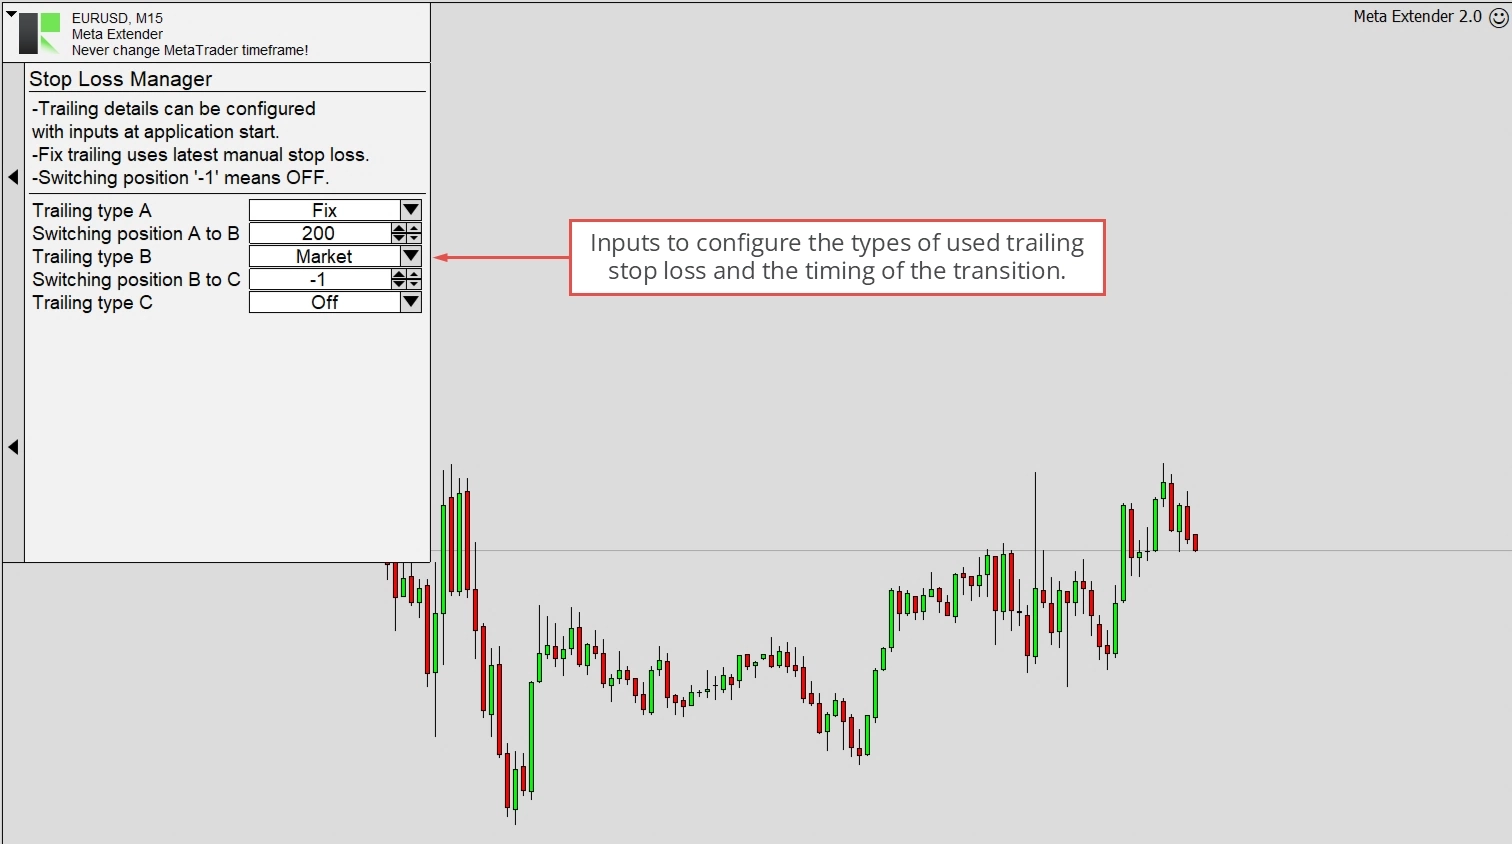
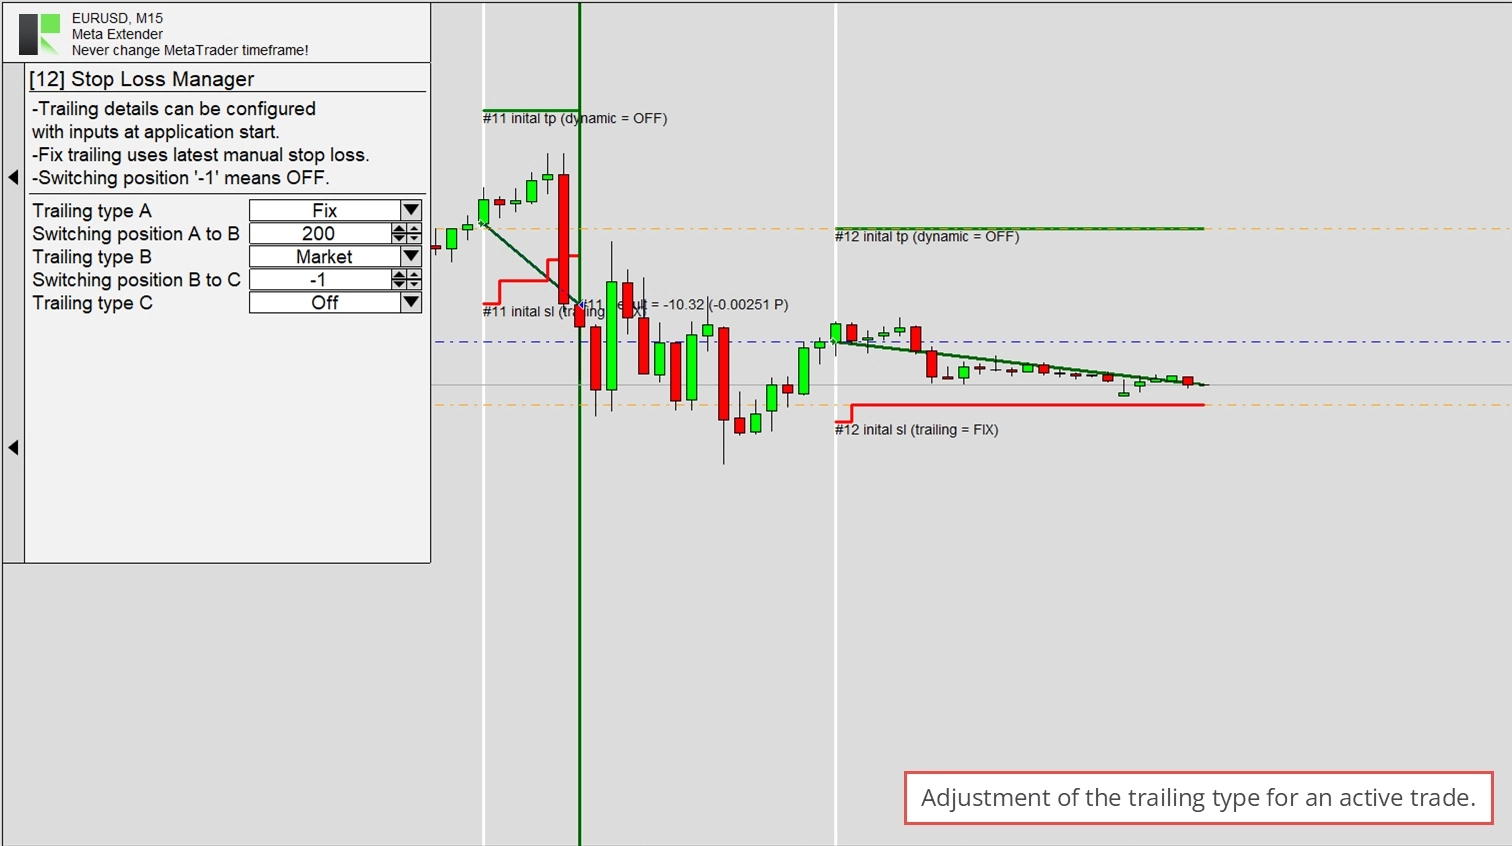
Once the trailing method is configured, it applies to the entire Meta Extender and every trade opened with it. In short, the window below serves as the settings window for the Meta Extender. Some settings can be configured when the application starts, and some can be changed individually for each trade. This ensures that your stop loss characteristic remains reproducible. The following section focuses only on the changeable input parameters while executing the application. Please refer to this article to get information about the input parameters for the Meta Extender that can be adjusted when the application starts.
As you can see below, the widget comes only with five input parameters. Three of them define the applied stop loss trailing methods (Trailing type A, Trailing type B, Trailing type C), and two represent when the switch between the trailing methods will take place. With these input parameters, it is easy to instruct the Meta Extender to start with a Breakeven trailing and activate the ATR-based stop loss trailing once the profit increases further. The configuration is stored for each opened trade individually, meaning you can change the parameters on this page according to the trade you wish to open next. Currently opened trades won’t be influenced by changes on this page.
As already mentioned, this setting applies to the entire Meta Extender. This is particularly true for the Trading Assistant and Trendline Trading. To enable the Meta Extender for a new trade, the Trailing input switch in the Trading Assistant window has to be enabled. Only then is the Meta Extender profile configuration taken into account. The trailing for the Trendline Trading widgets can also be allowed and disabled with this input switch.
Please refer to the illustration below to understand how the Meta Extender works. As you can see, this illustration displays a performed trade with enabled stop loss management. In the first phase of the trade, Breakeven trailing was active (Trailing type A). As soon as the trigger point (Switching position AB) for switching was reached, the Trailing type B (ATRS) became active. With further progress and reaching the next trigger point (Switching position BC), the Meta Extender changes to the Market Trailing method (Trailing type C).
The switching position is defined as follows: The initial stop loss difference when a trade is opened represents the unitless value of 100; let’s assume it has been 80 pips. When the Switching position AB is configured to 150, the actual change in trailing types occurs when the price reaches 120 pips above the initial stop loss. The initial stop loss is used as a static reference for this calculation.
You can choose from the following trailing types. Each trailing method can be used for different trading strategies. Some are indicator-based, and some are market-based:
- Off
- Fix
- Breakeven
- Market
- ATRS
- Parabolic SAR
- Stepwise
- Time closing
- Linear
- Last High/Low
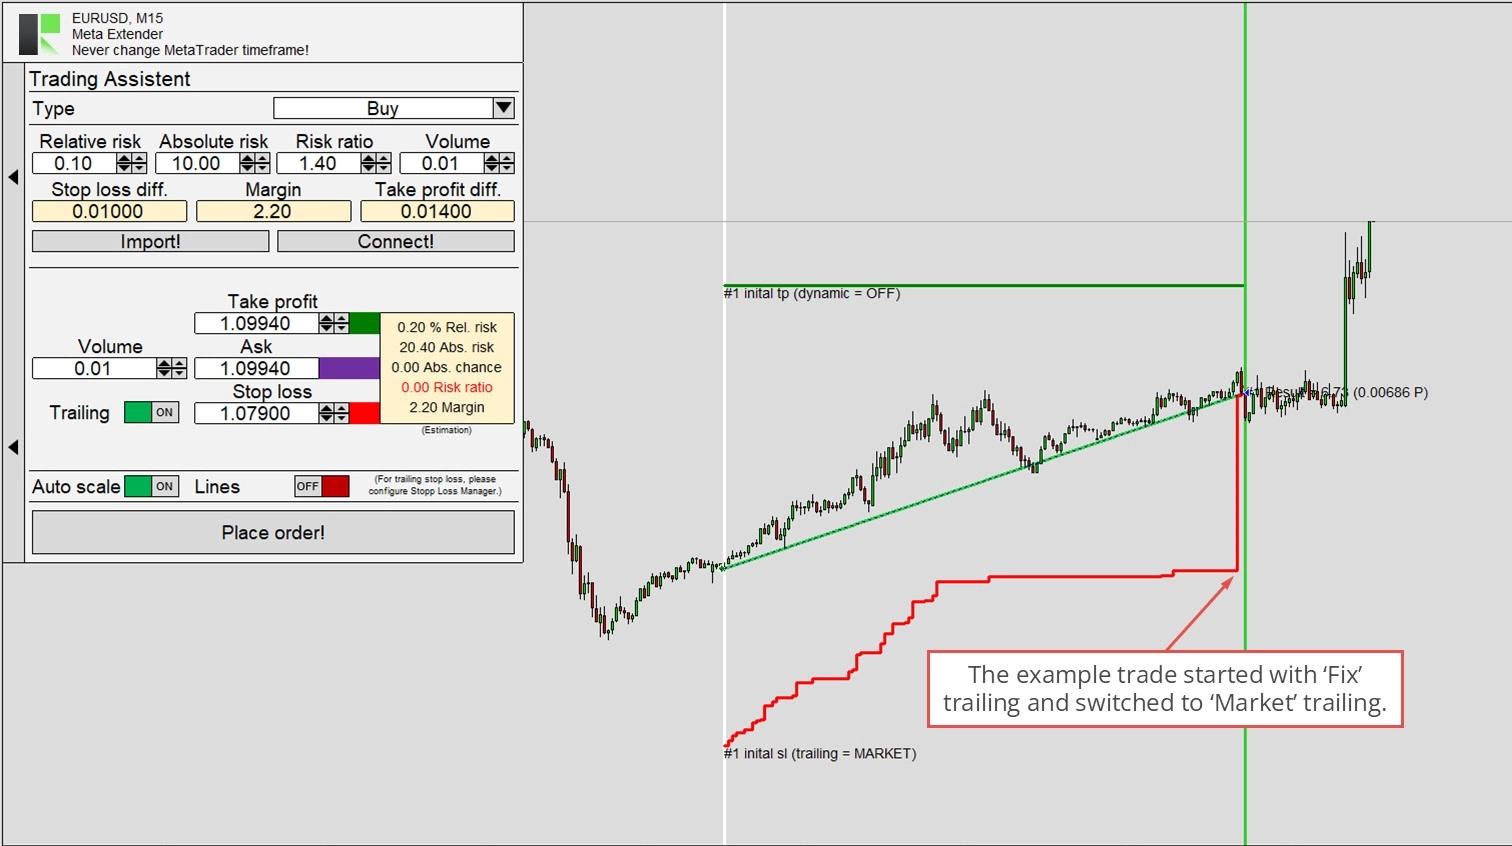
These methods can be combined to match your stop loss preference. The default setup is a fixed distance trailing and a relatively late switch to market trailing. This is useful for moving close to the current price when a significant profit is secured. This characteristic can be seen in the image below, which shows a trade opened with the Trading Assistant widget and enabled trailing.
Inspector
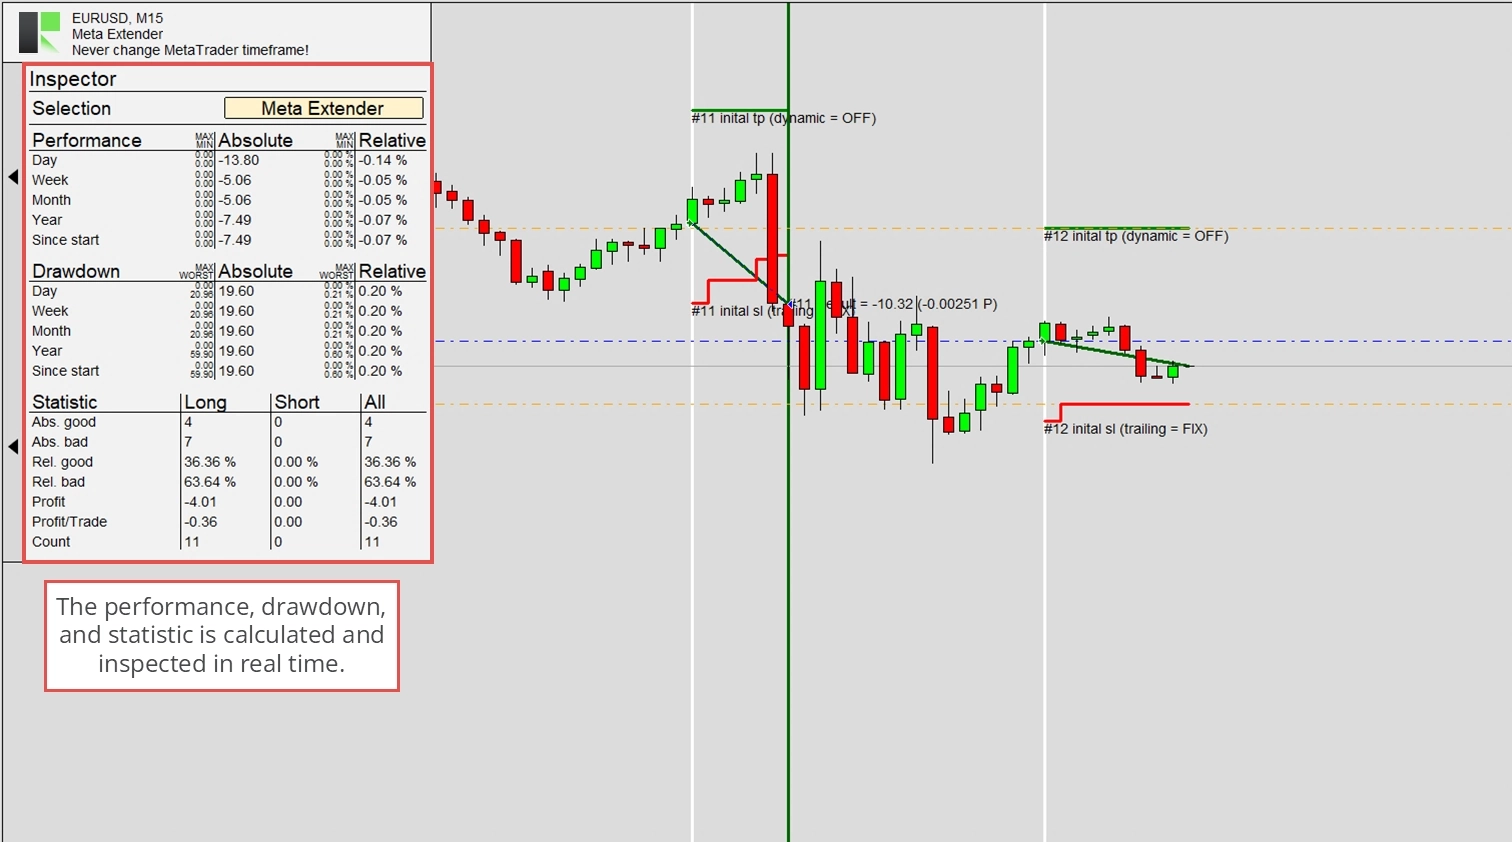
Self-awareness of current trading performance and drawdown is crucial for professional trading. While periods of negative results are regular, it’s essential to ensure that long-term results are positive. This can be challenging, especially for day trading, with numerous positions opened and closed daily. To aid in understanding your performance and drawdown, the Meta Extender incorporates the Inspector engine. This algorithm continuously calculates real-time performance, drawdown, and statistics for various periods, keeping you updated.
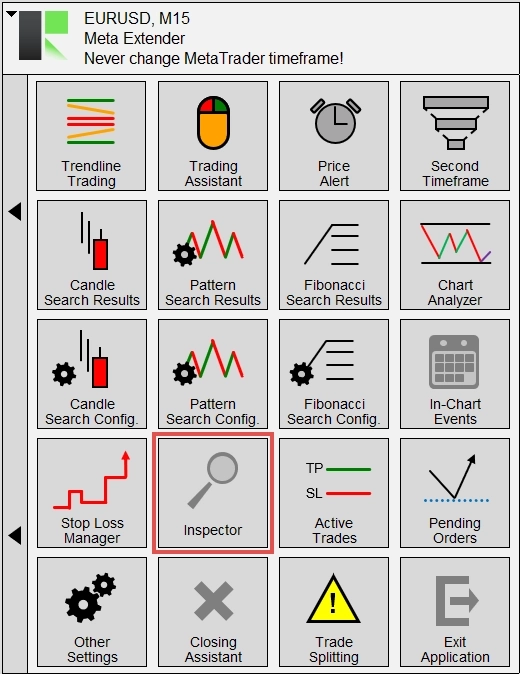
You can access the widget by navigating to Inspector from your Meta Extender home screen.
You’ll find a performance section, a drawdown section, and a statistics section with corresponding values for different periods. Each value is available as absolute and relative results - the time period-based values reset at the beginning of the next period. For instance, daily results reset every day at midnight; weekly results reset on the night from Saturday to Sunday; and so on.
While this serves an informative purpose, it can also block trading when a specific performance or drawdown limit, whether bad or good, is reached. The inputs section explains all the input parameters for this widget that can be configured at the start of the application. Please refer to this article to understand how the protection feature works.
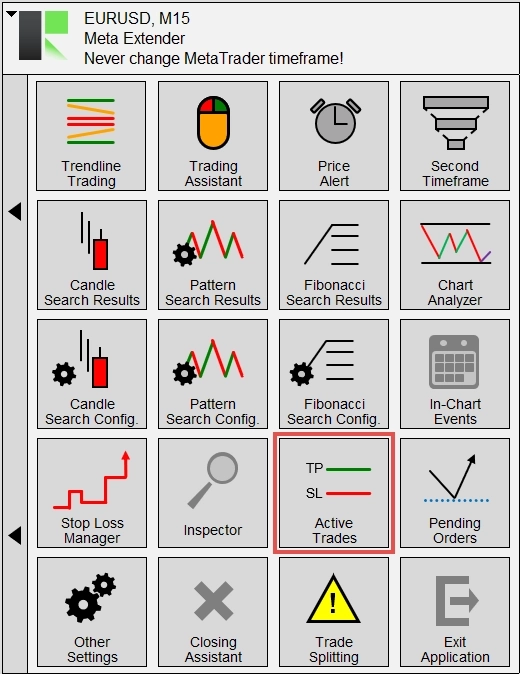
Active Trades
The Active Trades widget provides a table listing all currently open trades. This table includes all the information shown in the MetaTrader’s Trade tab. It also allows you to change each trade’s stop loss trailing method individually and reconfigure the trade splitting settings. To open the active trades table, navigate to Active Trades from your Meta Extender home screen.
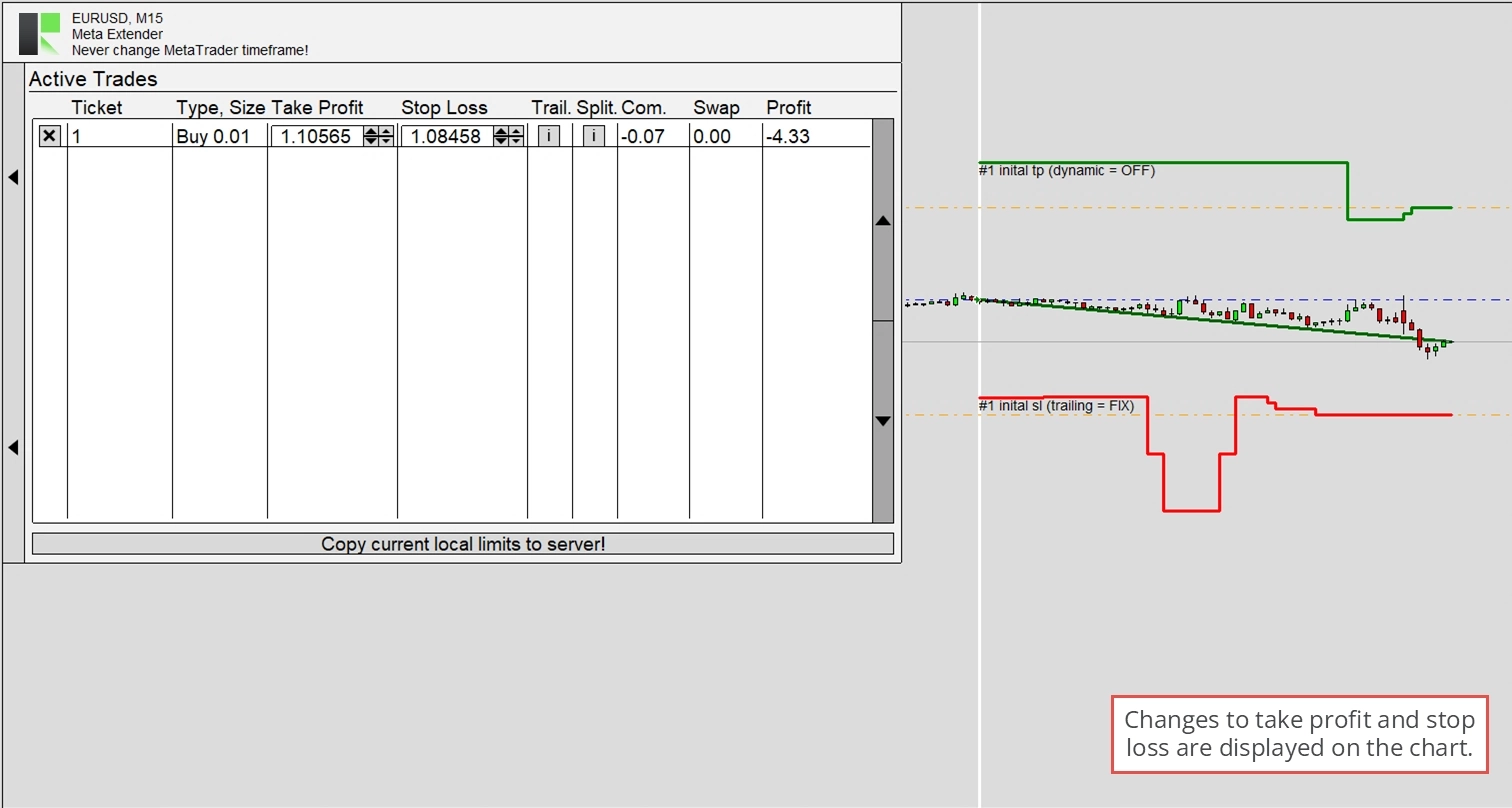
In this table, you can close and modify each trade individually. The image below shows that the stop loss and take profit lines are updated according to their values. This helps you understand how to stop loss trailing work or how you adjusted the limit values yourself. The Meta Extender offers the ability to maintain the stop loss and take profit values locally instead of sending each modification to your broker’s server. If this feature is enabled, the MetaTrader’s tab view won’t show any stop loss and take profit, but the Active Trades table would.
Use the info buttons to open each trade’s Meta Extender settings or Trade Splitting configuration.
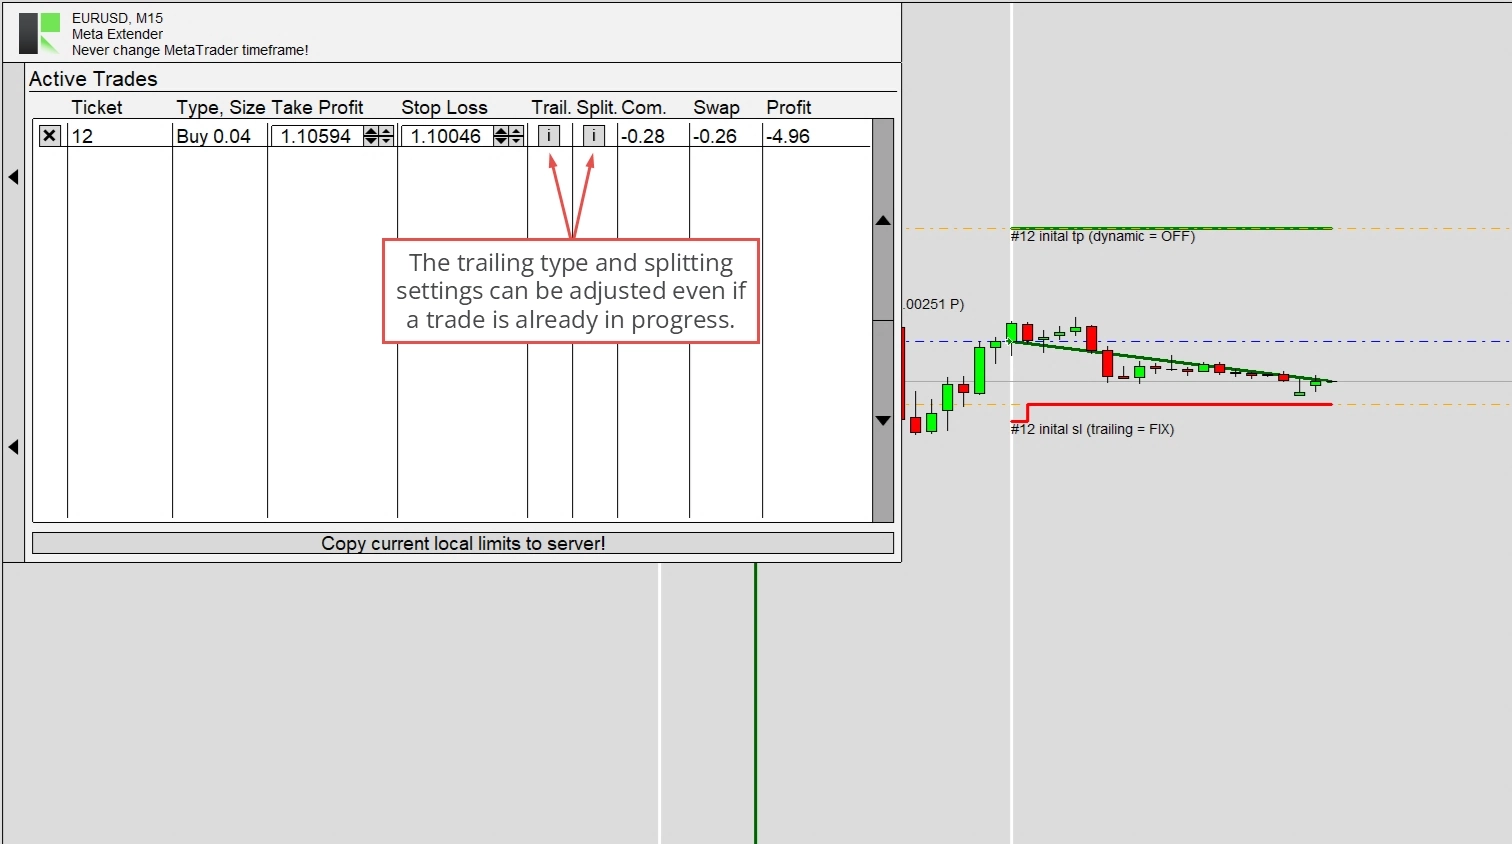
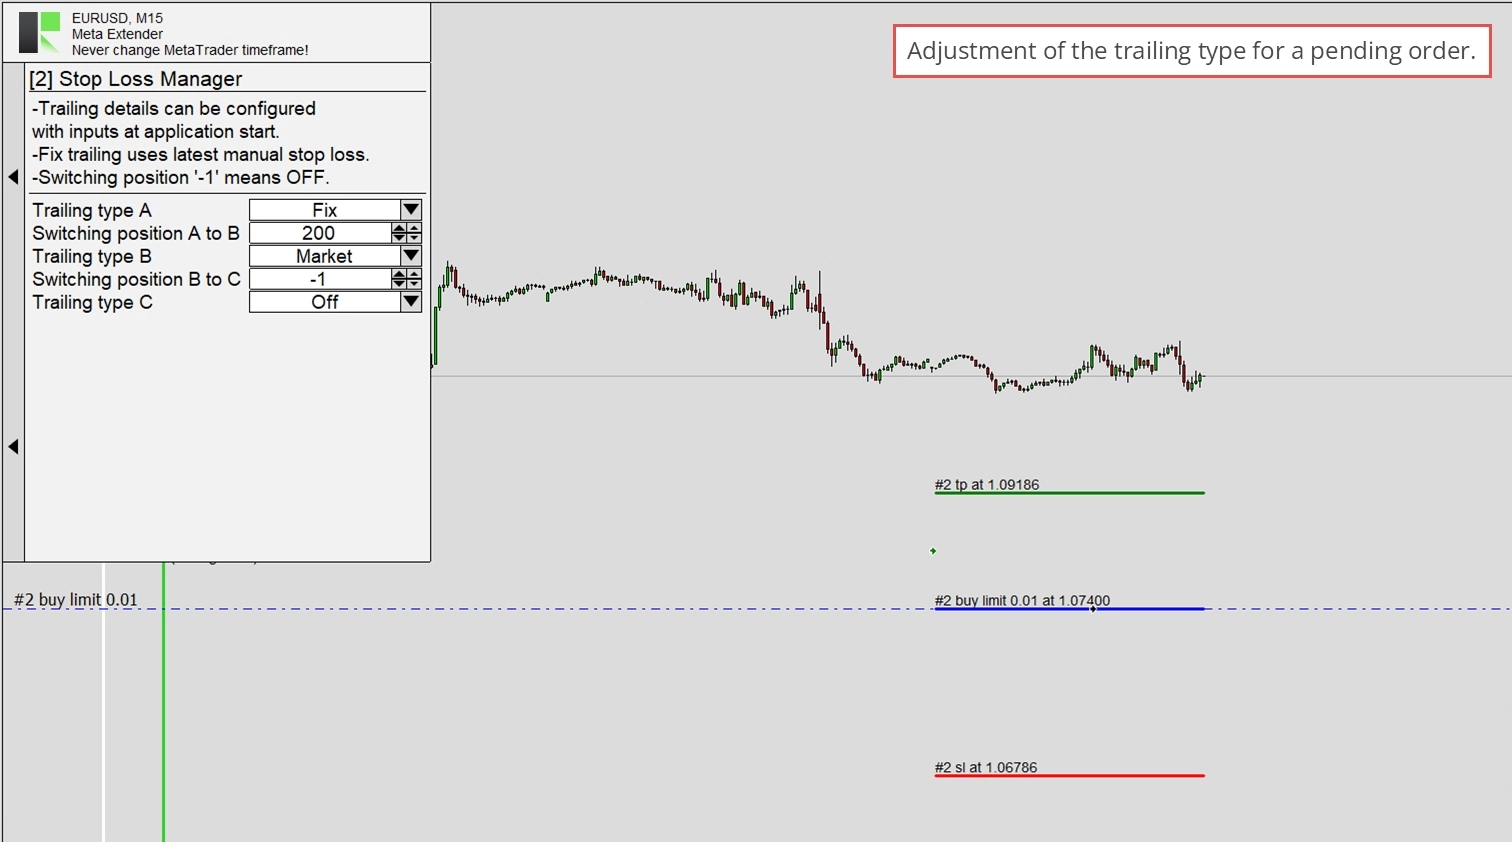
The info button for adjusting the trailing option opens a window that looks like the Meta Extender. With it, you can readjust according to your needs. Each trade maintains its independent stop loss trailing settings.
The second info button opens the Trade Splitting configuration. This widget is explained later in this article. Generally, it looks the same as the actual widget.
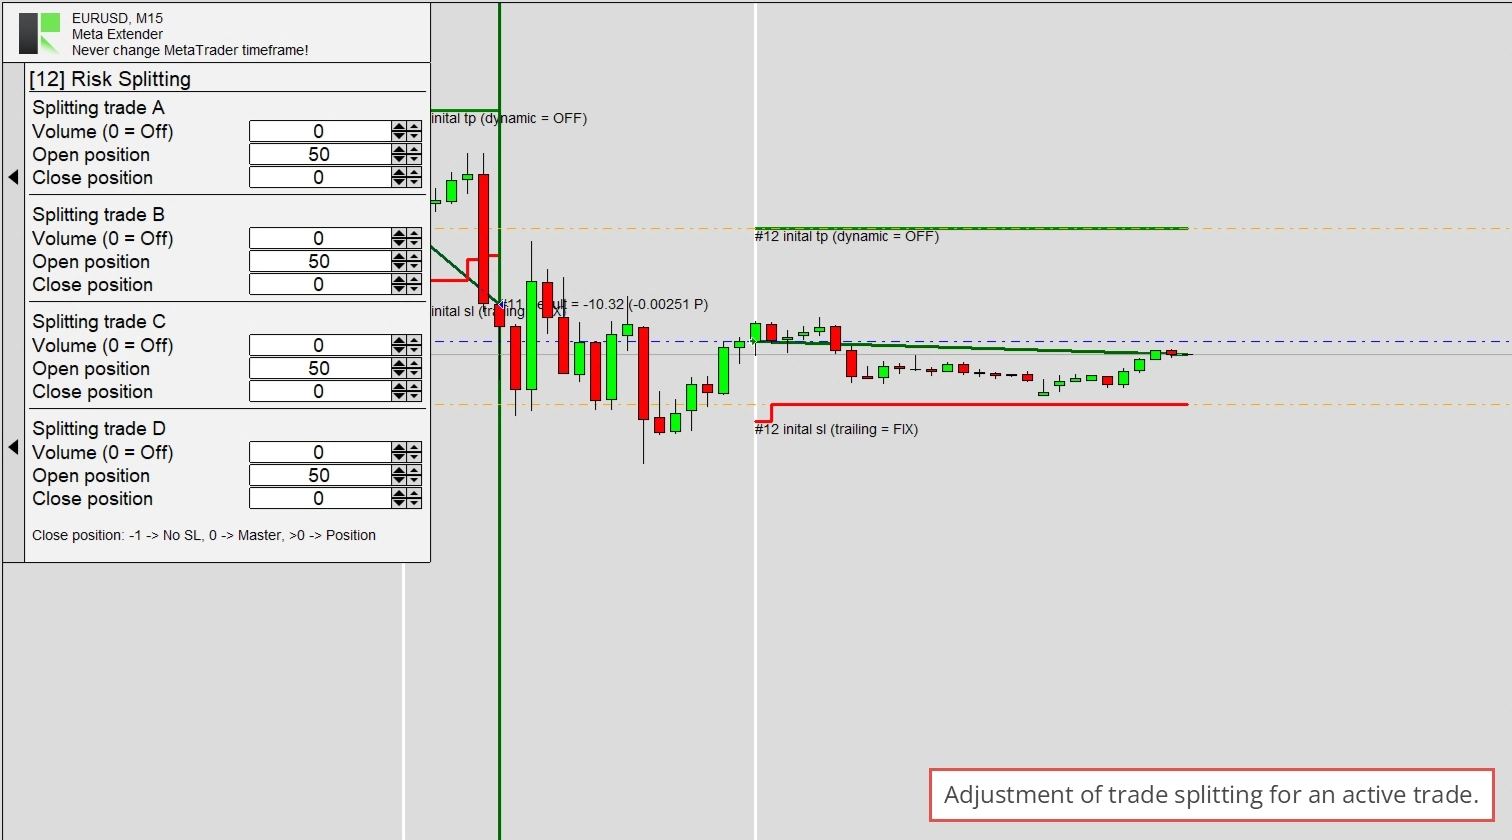
Both info windows can be interpreted as a snapshot of when the trade was opened. Please note that the active trades do not list any pending orders.
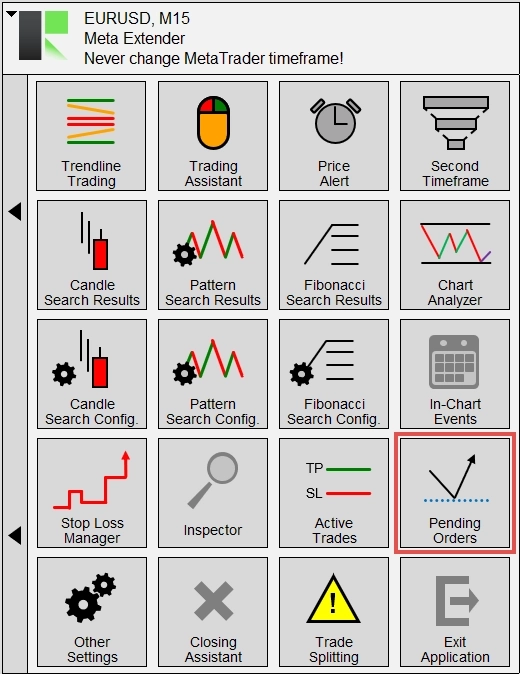
Pending Orders
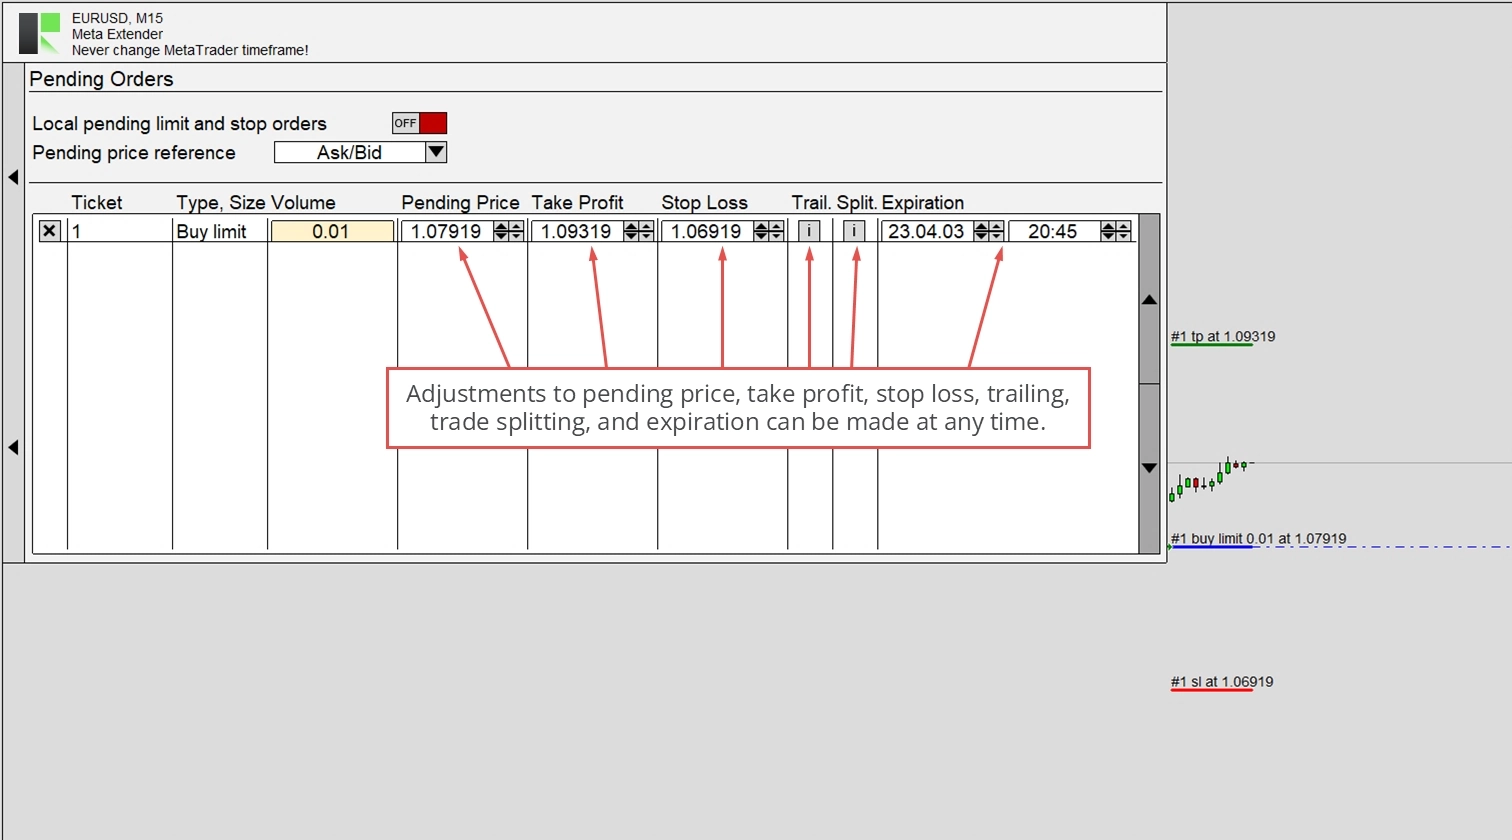
Pending orders, such as limit and stop orders, are listed in a separate table. You can access it by opening the Pending Orders widget from your home screen.
The functionality is similar to the active trades table, except that the pending price and expiration date can also be modified. Limit orders often have a significant impact on the process of price generation. In most cases, this might not affect your trading. But you can enable the local pending feature if you want to use a stealth mode. If Local pending limit and stop orders are enabled, the actual pending order will not be sent to your broker’s server, nor will it appear in the MetaTrader’s Trade view. Instead, the information about the pending order is managed locally. Then, a regular sell or buy market order is executed when the pending price is reached according to the order type.
This feature also enables the possibility of changing the pending price reference. For example, a buy stop order usually uses the asking price to trigger a trade; with the local pending orders feature, you can use other prices, like the middle value between the bid and ask instead. This is particularly useful for reacting to higher spreads in very volatile markets. Usually, a broker widens the spread, thus increasing the ask and lowering the bid price; this might not reflect the actual price movement since your broker’s spread characteristic influences it. This setting helps with faster trading styles like scalping and day trading.
As mentioned, the Meta Extender info screen looks the same as the widgets.
The same is true for the Trade Splitting info window.
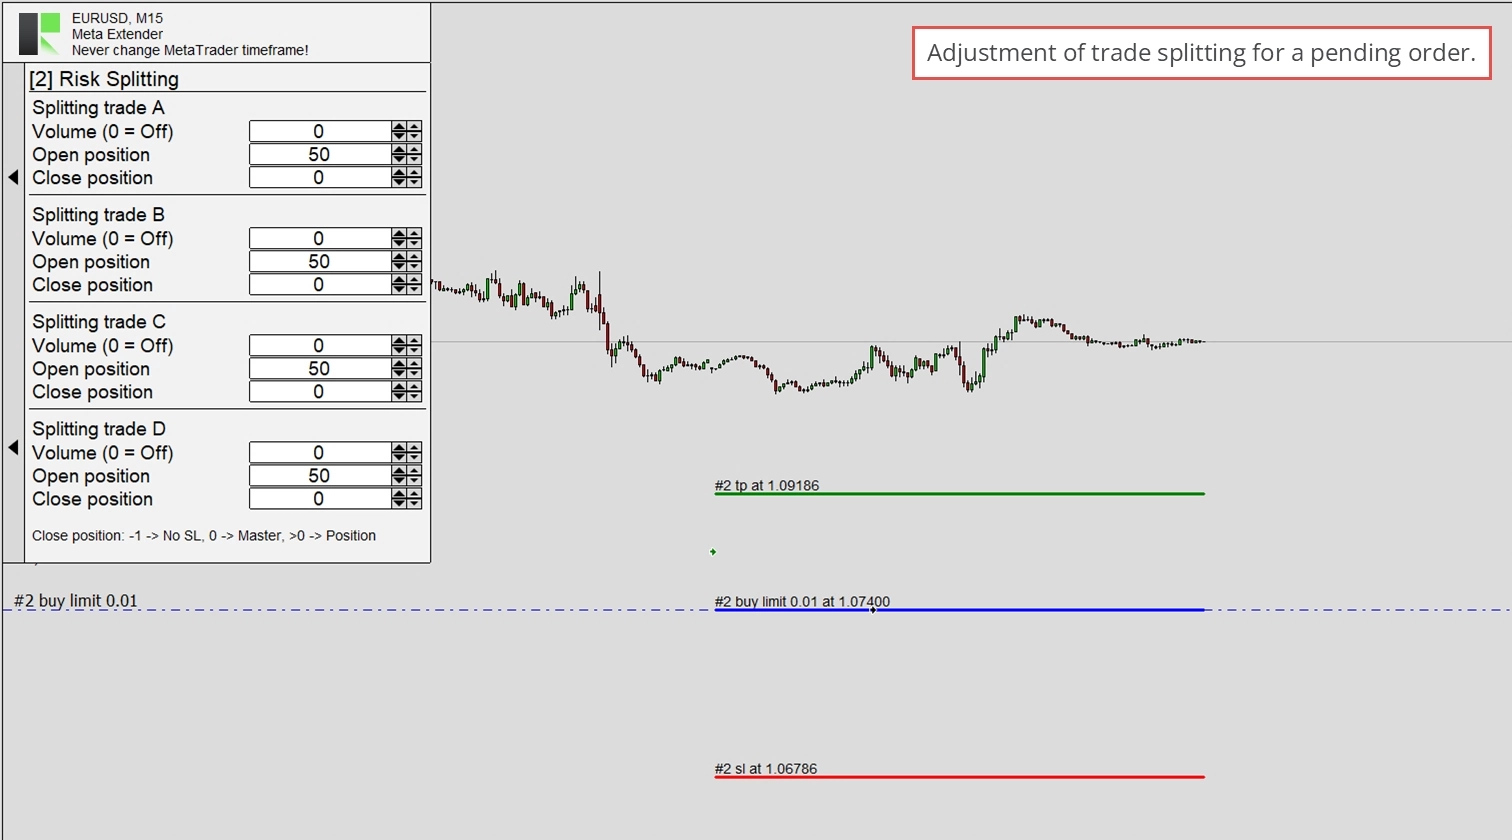
In both cases, the configuration is managed independently from other pending orders.
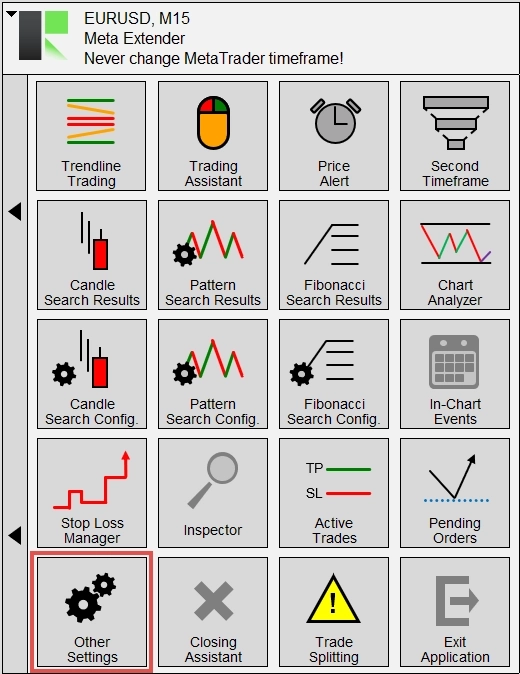
Other Setting
In the Other settings widget, you can find bulk settings to configure your notification preference and enable further features.
The Meta Extender can inform you about trade openings, trade closings, inspector events when a limit is reached, daily reports, found candles, chart or Fibonacci patterns, and price alerts. All notifications are, by default, only shown within the Meta Extender user interface. Additionally, you can configure to send the information via email or push notification on your mobile phone by enabling the features accordingly. Please refer to this article to inform yourself how to allow email and mobile notifications with your MetaTrader.
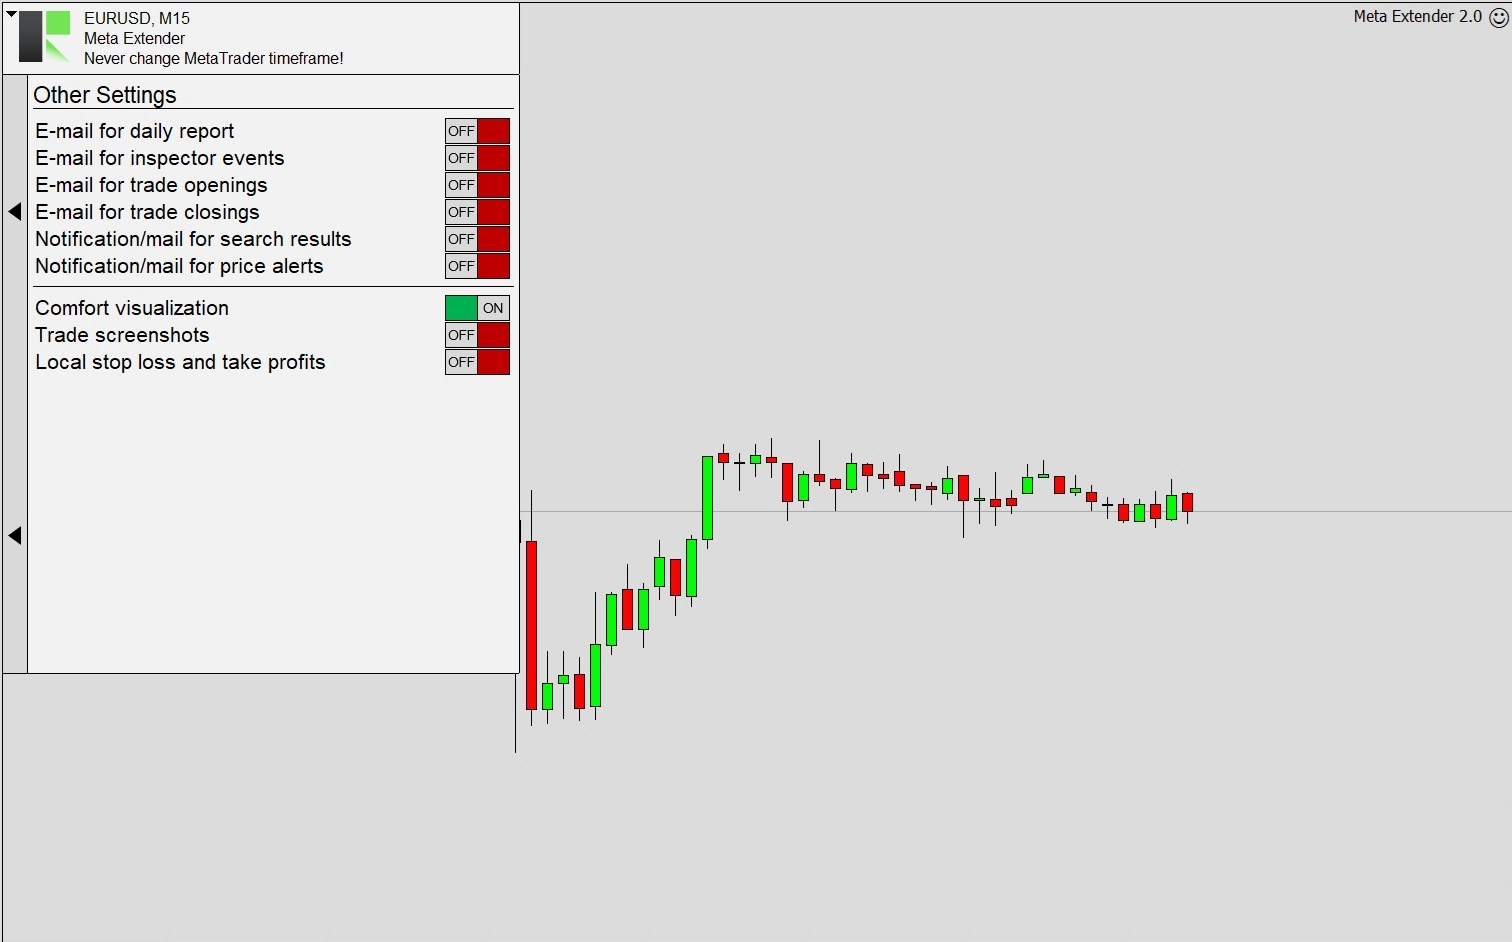
Additional settings are the following:
- Comfort visualization: As already shown, the Meta Extender displays a trade differently than the standard Meta Extender. For example, you can see how the stop loss and take profit were modified when a trade was opened and closed. However, if you do not like this type of visualization, please feel free to turn it off with this switch.
- Trade screenshots: If enabled, the Meta Extender saves a screenshot whenever you open and close a trade. This is useful to analyze performed trades in the aftermath analysis. The screenshots will be kept in an output folder.
- Local stop loss and take profit: Instead of sending the stop loss and take profit information to your broker, you can let the Meta Extender manage these values locally. Some brokers purposely use the stop loss information to insert peaks into their price charts to distract customers. By using local limits, you can make it hard for your broker to use your stop loss as a reference to adjust the price. Please take into account that this practice is only performed by unserious brokers. If you ever experience this, it’s recommended that you change your broker.
Closing Assistant
On your home screen, you’ll find a widget named Closing Assistant. This widget allows you to close multiple trades simultaneously.
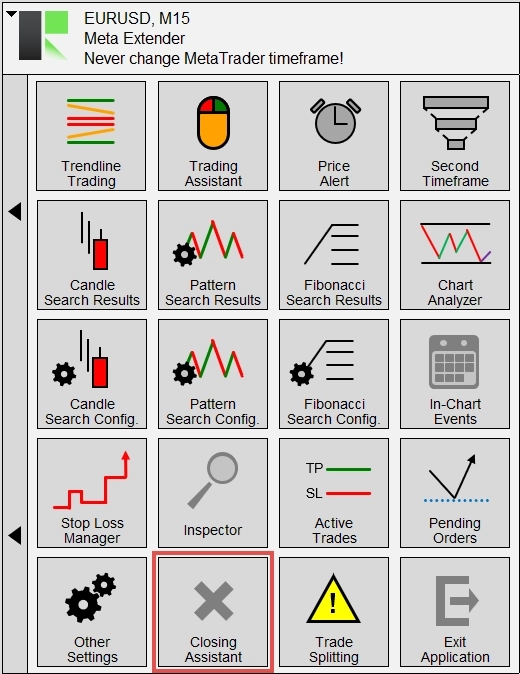
The widget has a single input parameter: the selection of trades to be closed. You can select one of the following options:
- Meta Extender: This option configures the widget to close only the trades opened with the Meta Extender.
- Symbol: This option configures the widget to close only the trades opened in the symbol on which the Meta Extender is currently applied.
- MetaTrader: This option configures the widget to close all trades that match the closing button description and are managed by your MetaTrader.
Remember that when Symbol or MetaTrader is selected, the Meta Extender also closes trades eventually opened by other applications.
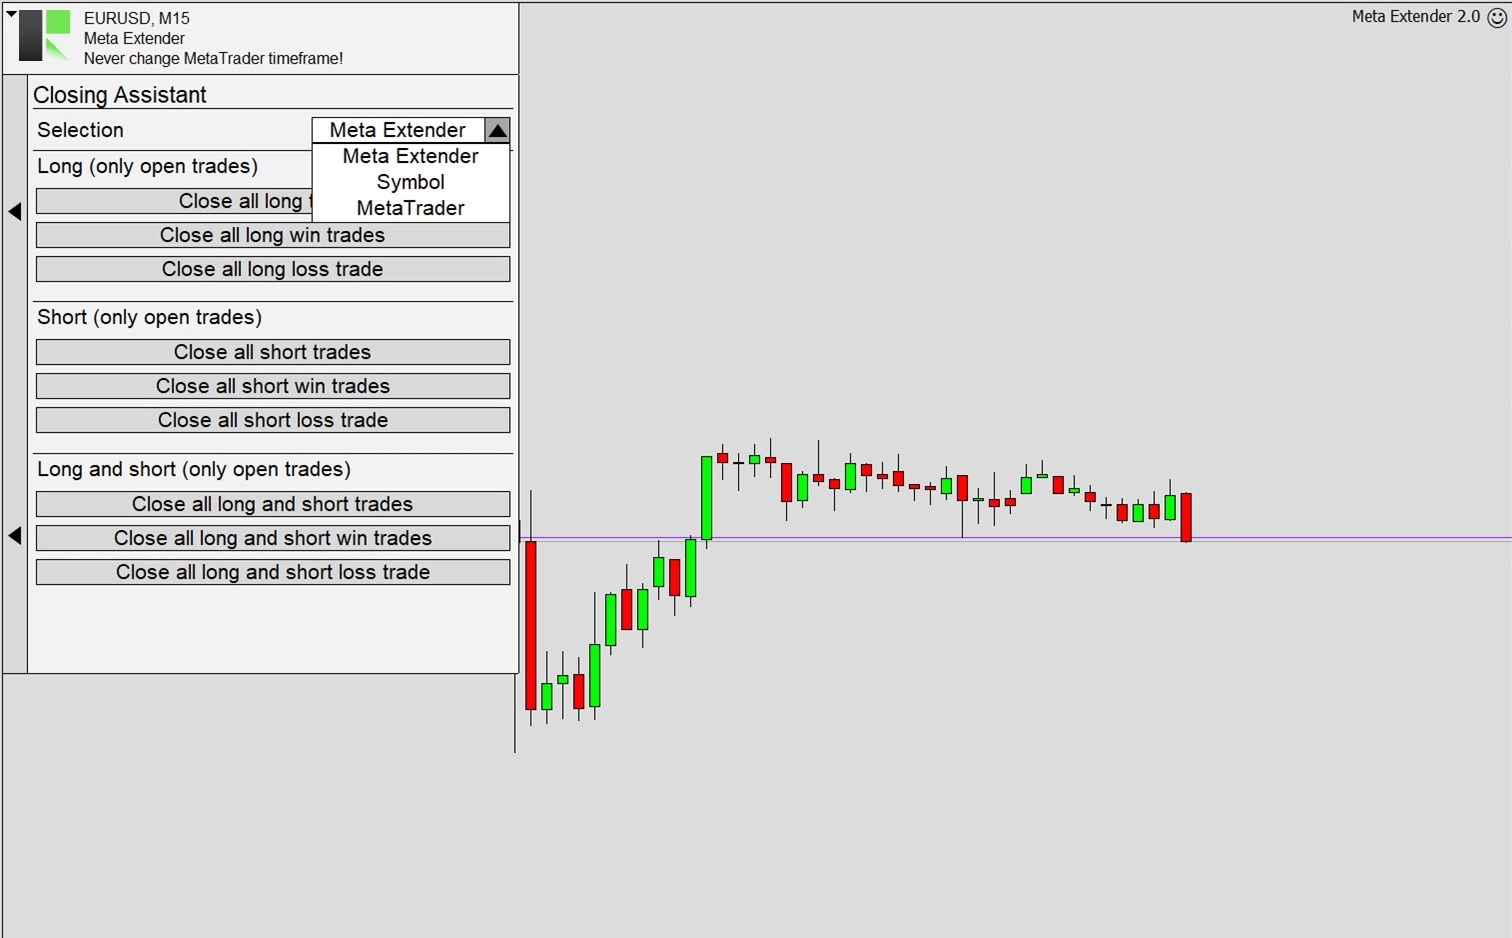
As shown in the widget view, you can use these options to close multiple trades with a single click. This feature is handy in fast-paced market conditions, allowing you to complete winning or losing trades.
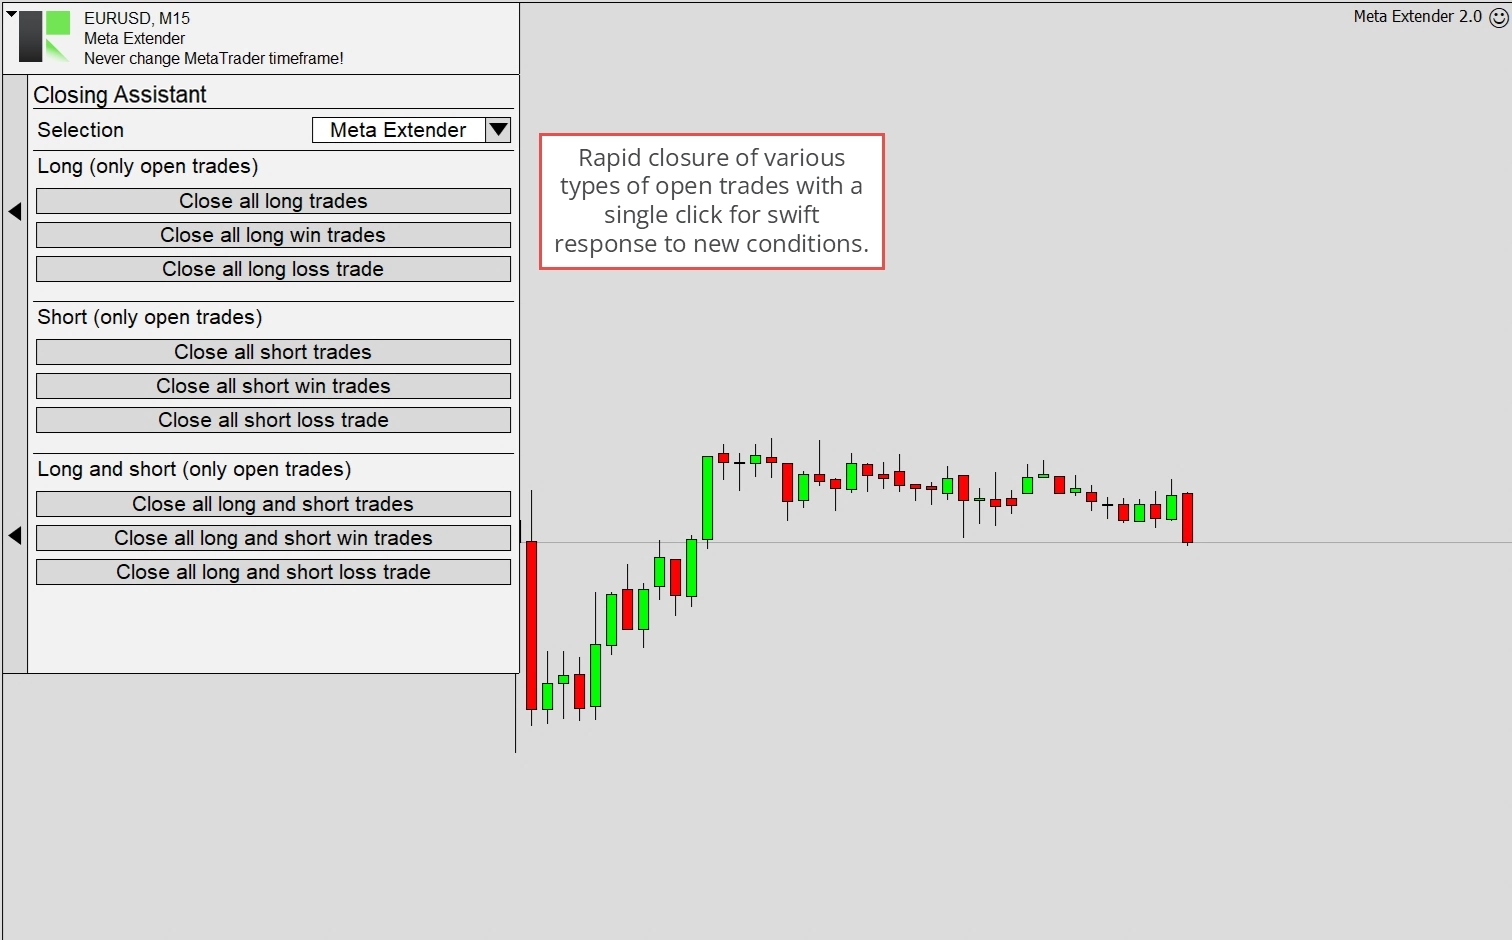
Please note that the Meta Extender will automatically close the trades meeting the closing criteria without further approval.
Trade Splitting
Trade splitting is a strategy in trading where a single trade is divided into several smaller trades. This approach is often used to manage risk and enhance trade execution. For example, a trader may split a trade into two or more parts instead of investing the entire amount. Each part is then executed separately. This can be done in any ratio, such as 50:50, 30:70, 50:30:20, 30:30:20:20 or other ratios. A tactic like that allows traders to maximize their profits and minimize losses by adjusting based on the market’s response to the initial trade. It’s a flexible strategy that can be particularly beneficial in volatile markets.
The Trade Splitting widget, accessible from your home screen, allows you to split your trade into up to four sub-trades. Each sub-trade can have different trade entry and exit points, with the first trade used as a reference, the so-called master trade. The first trade (master) is the one you configure with the Trading Assistant or Trendline Trading widget. When any trade is opened, the Trade Splitting settings automatically apply.
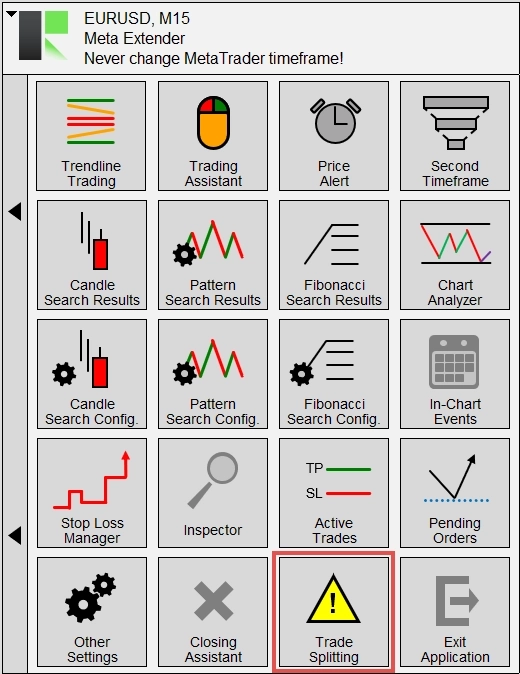
The functionality of the Trade Splitting widget is illustrated below.
As with the Meta Extender, the initial stop loss difference of the master trade serves as the reference for each split trade. It represents the unitless value of 100. Let’s assume the initial stop loss difference is 100 pips. If the input parameter Splitting trade A - Open position is set to 190, the second trade will be opened when the price reaches the point: Master trade initial stop loss + 190 pips. Splitting trade B, configured with the open position 210, will then be opened at the master trade initial stop loss value + 210 pips. This relative price description is also used to define the take profit value, which will be used to close the trade. Please note that the stop loss will be reused from the master trade, even with the same trailing characteristic.
Based on this relative price position description, the minimum value of the open positions can be 0, and the take profit level of the master trade defines the maximum value. For the closing position, the same minimum and maximum values apply, except 0, which means the same take profit as the master trade will be used, and -1, which means no take profit is used.
A split trade is only active if the volume is unequal to zero but larger than 0. This input parameter is a percentage of the master trades’ volume. For example, if the master trade is open with 1.20 lots then Splitting trade B - Volume = 50 means a trade with 0.60 lots in volume size will be opened when Splitting trade B - Open position is reached. A split trade is disabled when the volume configuration equals 0.
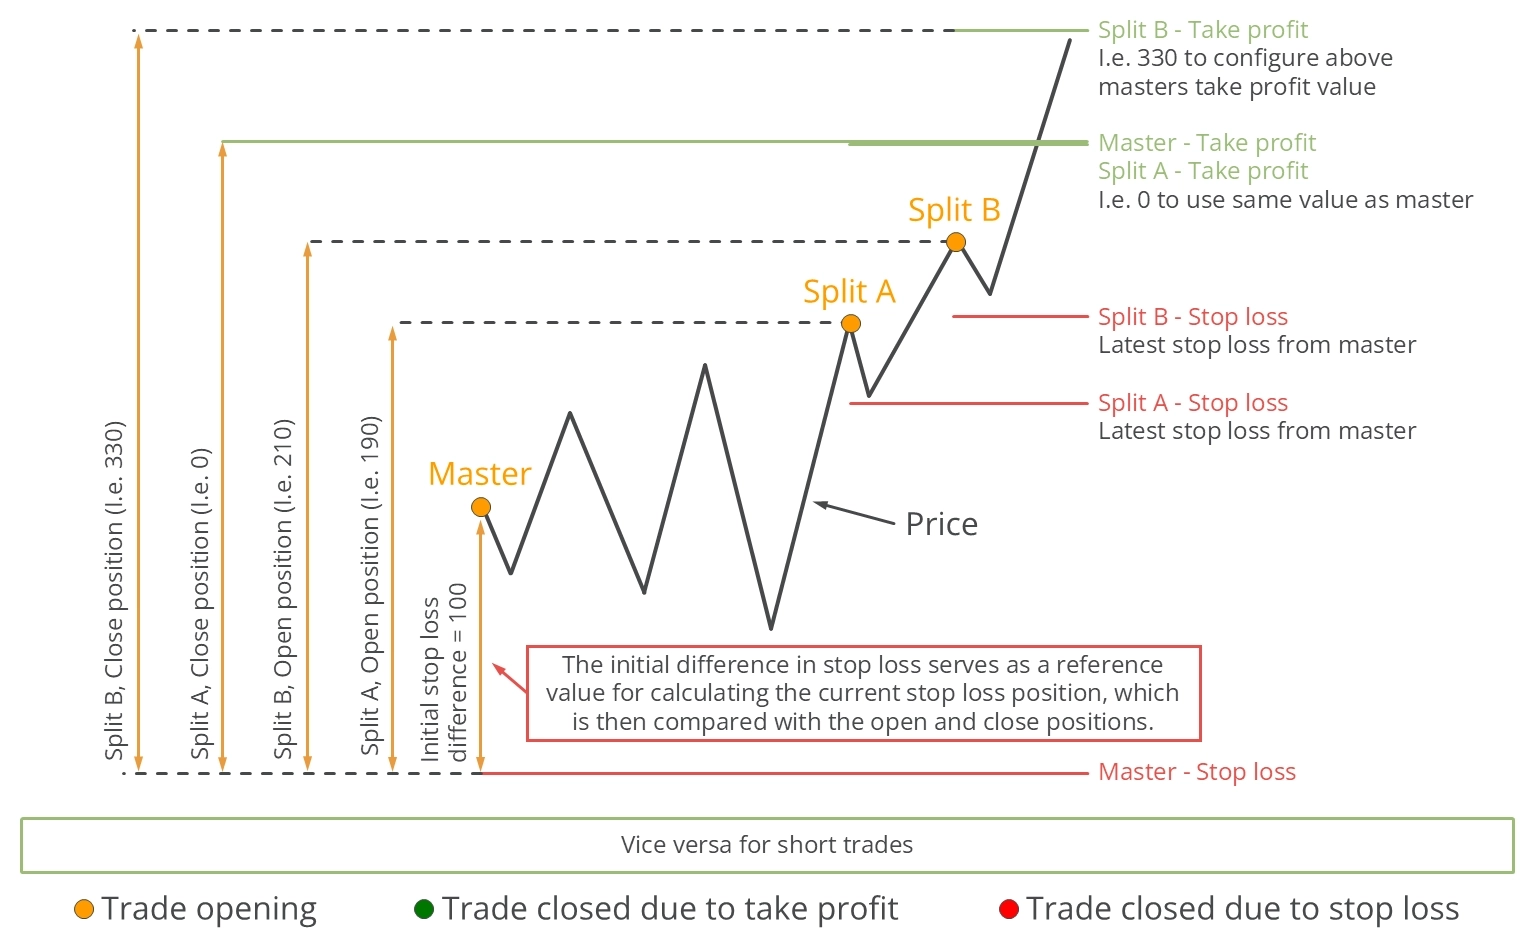
The following illustration demonstrates a trade splitting configuration with one configured split trade. The open position (Splitting trade A) is set to 50, which implies that the master trade must fall halfway to the stop loss to trigger the split trade. This feature can repurchase the same asset when its price decreases, increasing the volume held.
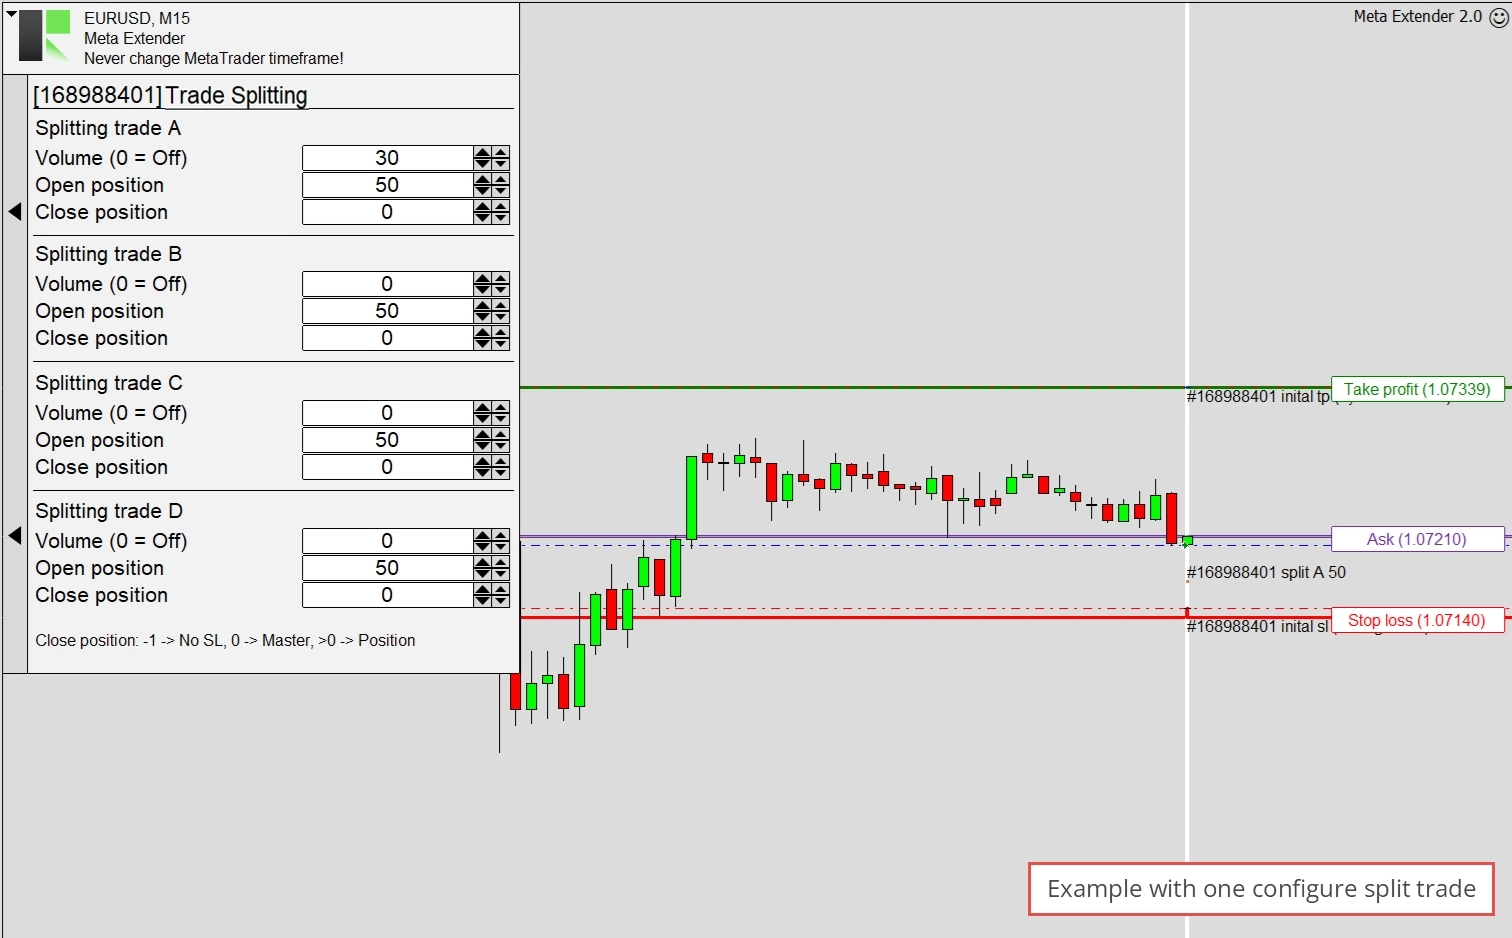
In the following image, you will see two split trades. Splitting trade A - Open position is set to 30, which means it will be executed when the price falls below the opening price and is close to the stop loss. Splitting trade B will be opened when the price increases above the opening price and crosses the Splitting trade B - Open position, configured to 160. The open position is also displayed in the chart itself.
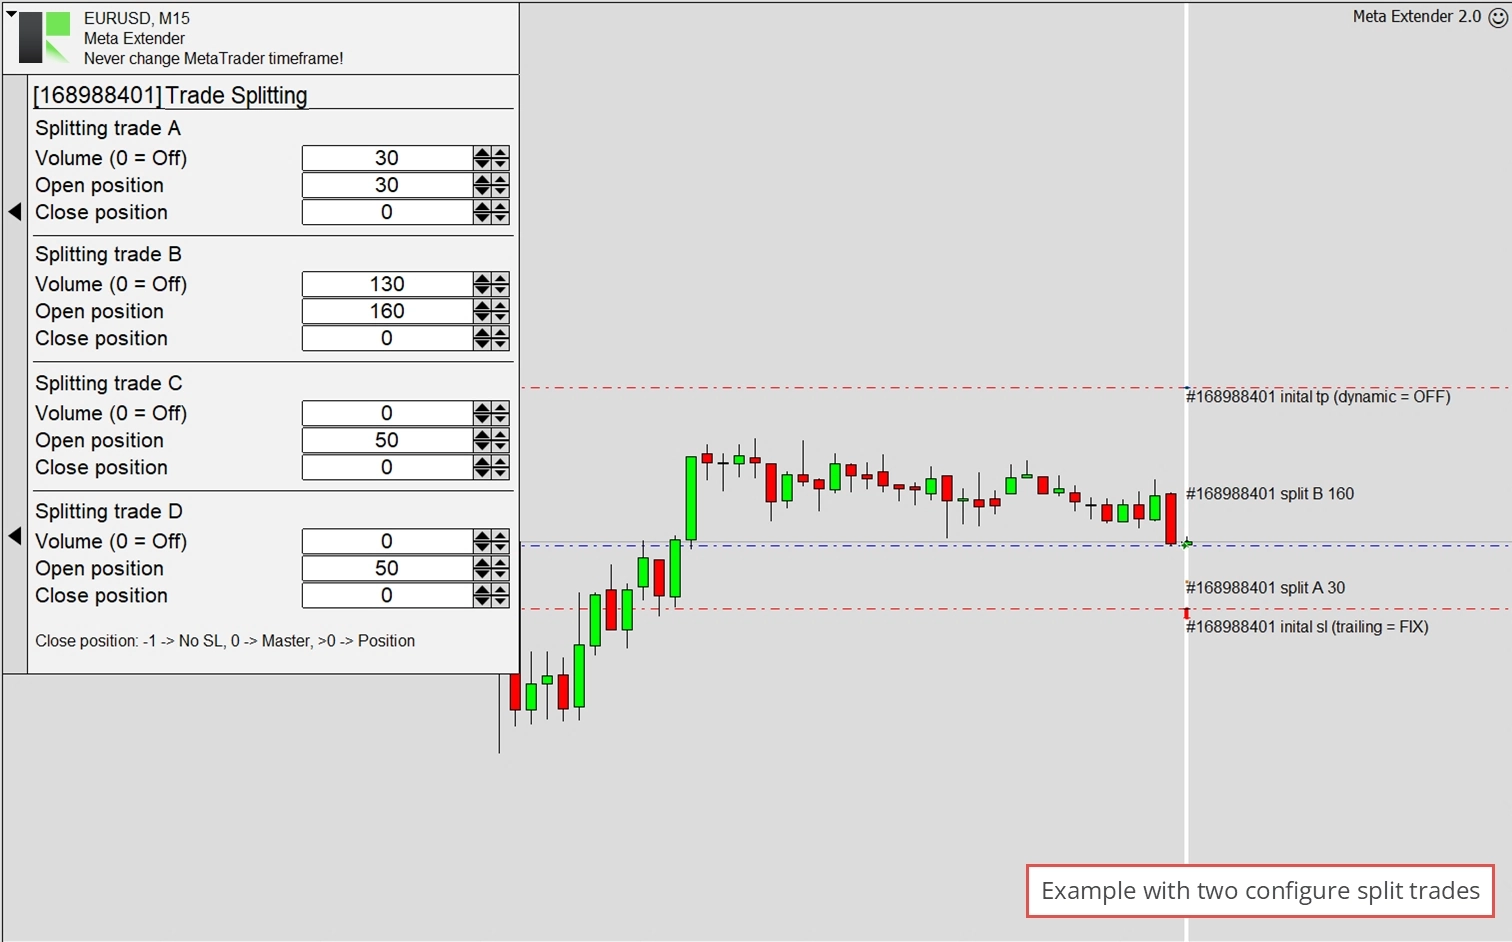
The last example illustrates a master trade configured with three split trades, but only one was triggered when the price decreased. Open positions are 50 (A), 120 (B), and 170 (C). The stop loss trailing method was taken from the master trade, and as you can see, the initial stop loss of Splitting trade A represents the stop loss value the master trade had when Splitting trade A was initiated. In this scenario, both trades were stopped out.
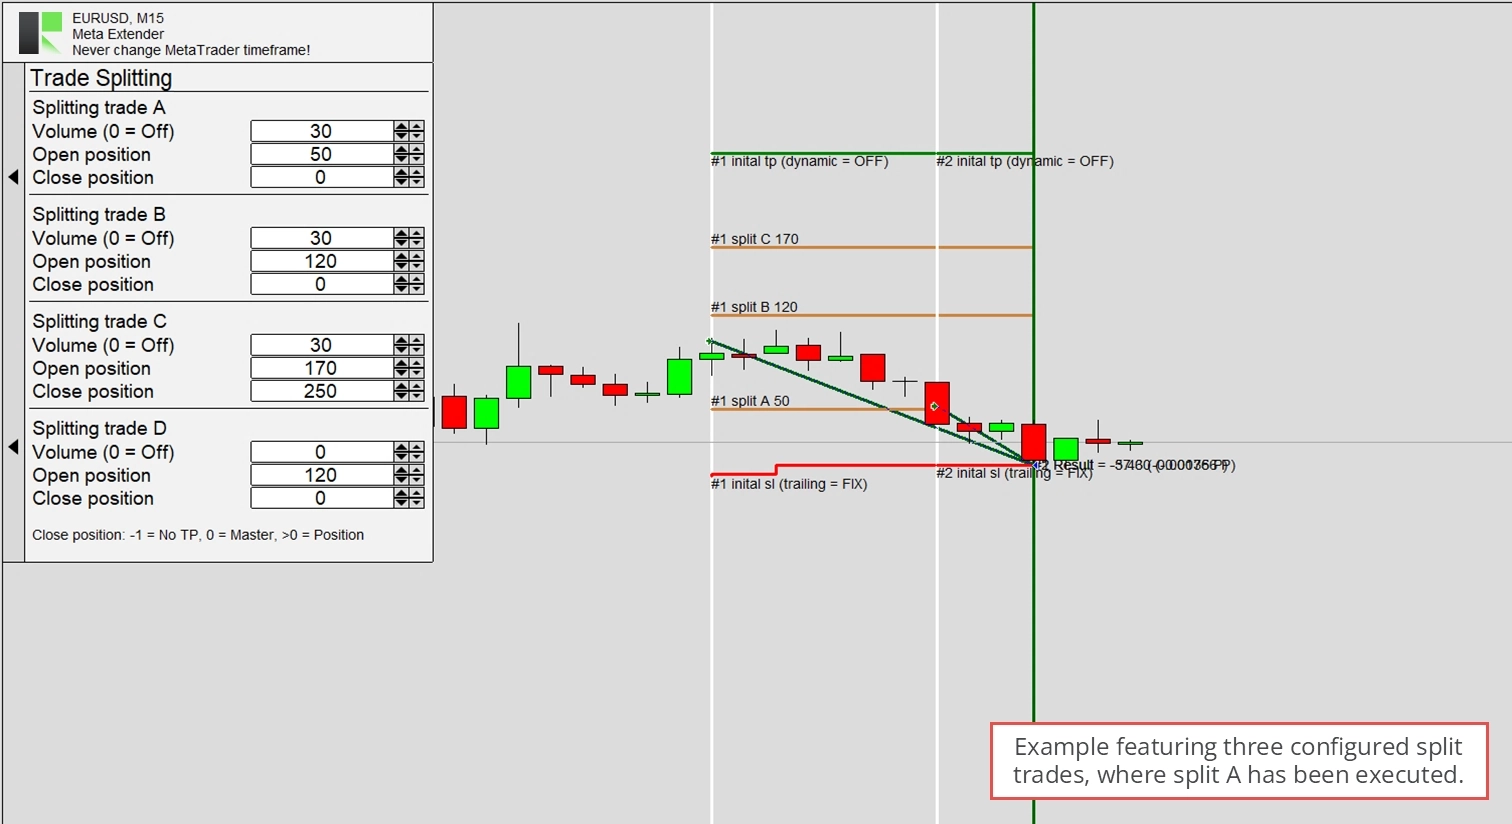
In essence, this widget offers a variety of trade-splitting strategies to mitigate risk and adapt to specific market conditions.
Exit Application
The final widget yet to be discussed is the Exit Application widget.
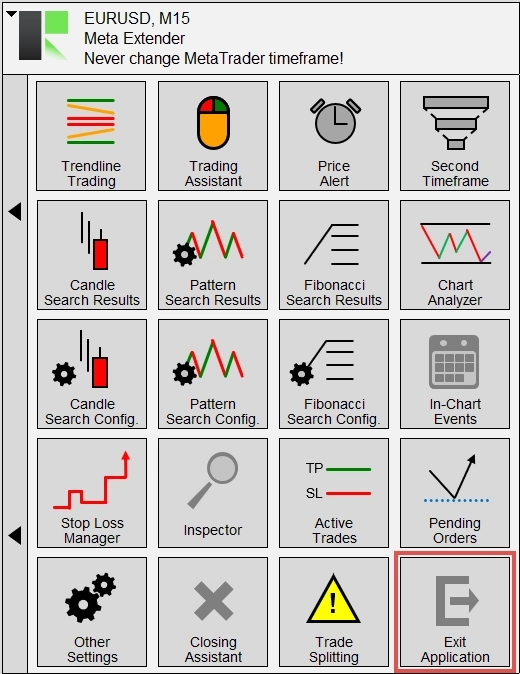
This widget allows you to close the Meta Extender. However, it’s worth noting that you can also exit the Meta Extender using the standard option MetaTrader provides to remove expert advisors.
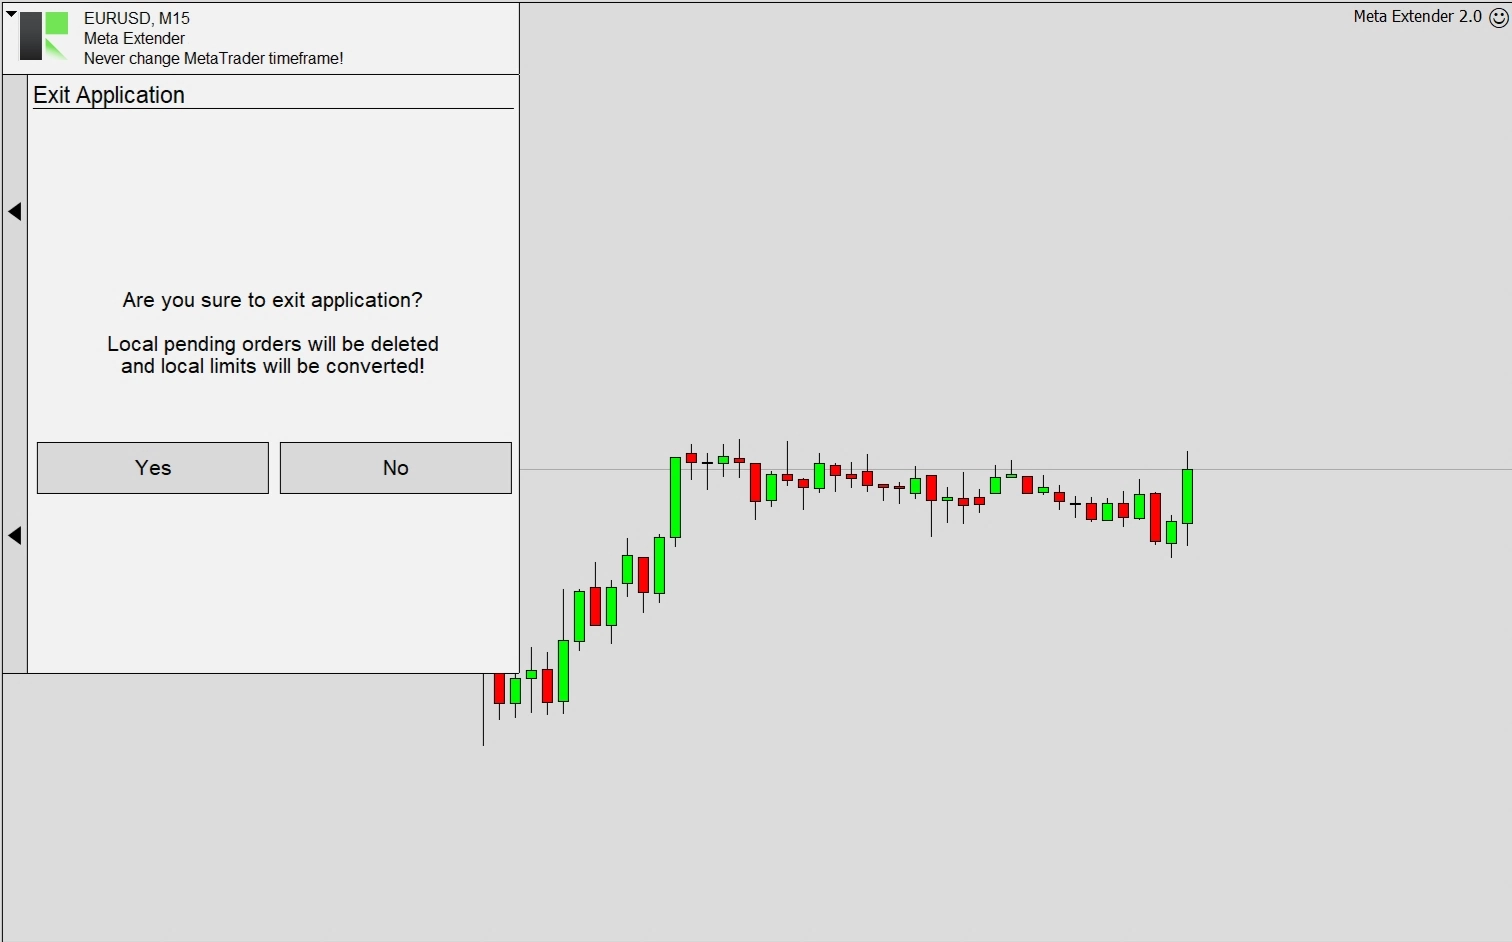
When the application is deactivated, any locally managed pending order will be deleted, and all locally managed stop loss and take profit orders will automatically be converted to server limits. As a result, your trades will continue to be protected, albeit without the sophisticated stop loss management.